

Working with Mind Maps
This page is the full reference for the mind map editor. It starts with the basics: creating a mind map, adding topics and subtopics, and editing topic text. Then it covers every topic toolbar button: what it does, the result and its shortcuts. For a quick tour, see Getting started.
Create a Mind Map
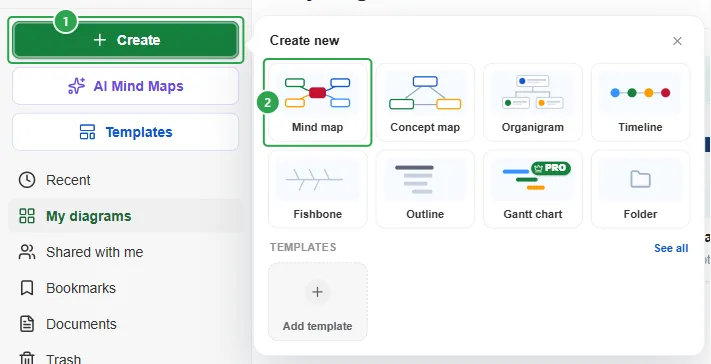
Section titled “Create a Mind Map”Click Create (1) at the top of the Dashboard’s left panel, then Mind map (2):
The new map opens in the editor right away, with only the central topic on the canvas:
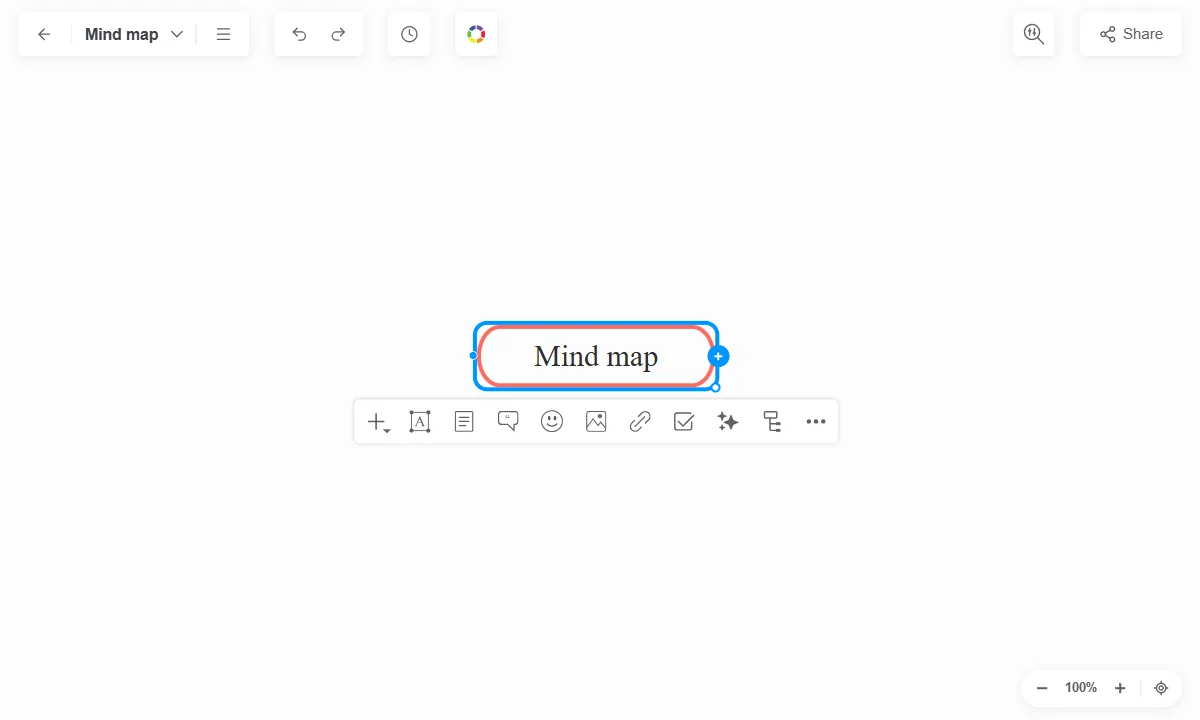
Every mind map grows from one central topic in the middle of the canvas: the main idea of the map. Topics attached to it are main topics, and topics attached to those, at any level, are subtopics. Unlike other topics, the central topic can’t have a sibling, a boundary or a summary.
The central topic’s text and the map’s name stay in sync: renaming one renames the other. To unlink them, turn off Link title with diagram name in Properties.
Topics and Subtopics
Section titled “Topics and Subtopics”When you select a topic, small bullets appear around it. Hover a bullet and it turns into a +; click it to add a topic on that side. The new topic is ready for you to type its text.
Start with the central topic. Select it and click the bullet on its left or right side to add a main topic there, or press TAB:

Every other topic has four bullets. The outer one adds a subtopic. The top and bottom ones add a sibling, a topic on the same level. The inner one adds a parent topic.
Hover a bullet to see what it adds, like Insert subtopic (1) on the right bullet of Main topic:
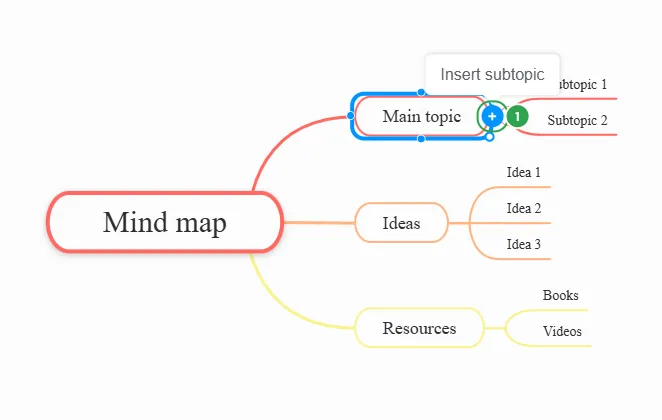
Click it, and the subtopic appears:

You can also just use the keyboard:
- TAB - insert a subtopic.
- ENTER - insert a sibling below.
- ALT+ENTER - insert a sibling with the same style.
- ALT+SHIFT+ENTER - insert a subtopic as a task.
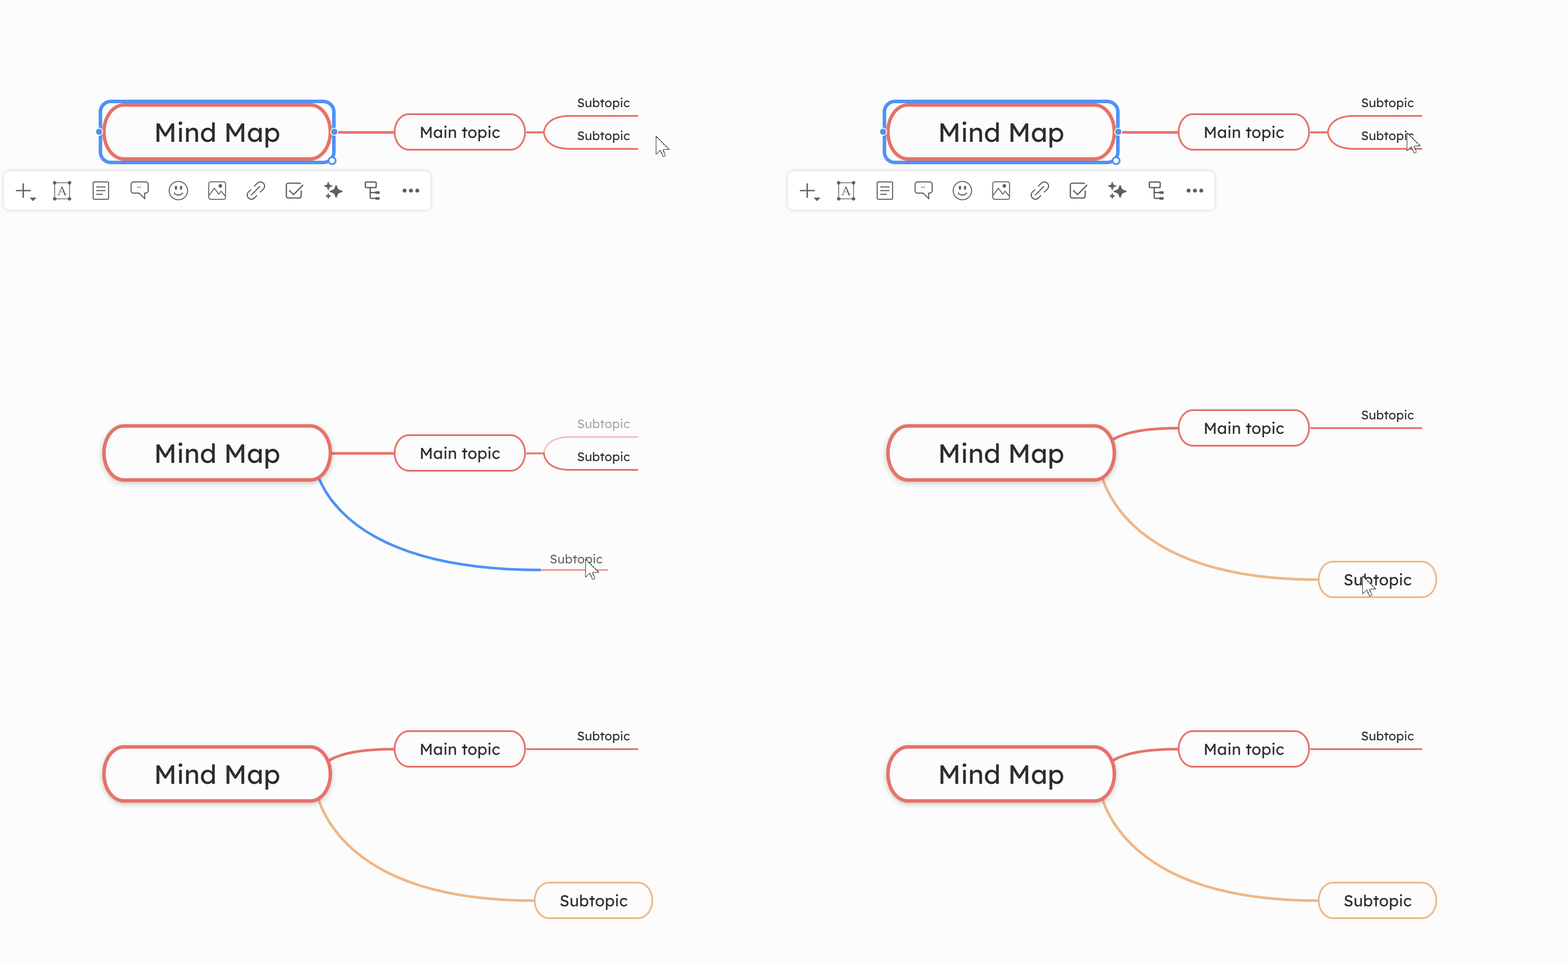
Drag a topic to move it. While you drag, a faded copy follows the mouse and a blue line shows where the topic will attach. Release the mouse button to drop it there:
Edit Topic Text
Section titled “Edit Topic Text”A new topic is ready for typing. To edit an existing topic, double-click it to select all its text, then click inside the text to place the cursor. Press SHIFT+ENTER for a new line inside the topic.
When you select words inside a topic, a small menu appears for styling only those words: color, bold, italic and other formatting, size, font and links:
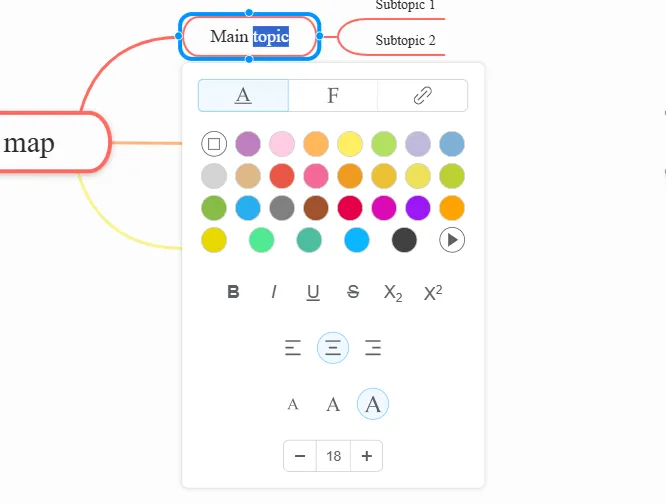
For more topic editing options, see Style.
Insert
Section titled “Insert”Select a topic, then click Insert (the + button) on the toolbar to open the Insert menu:
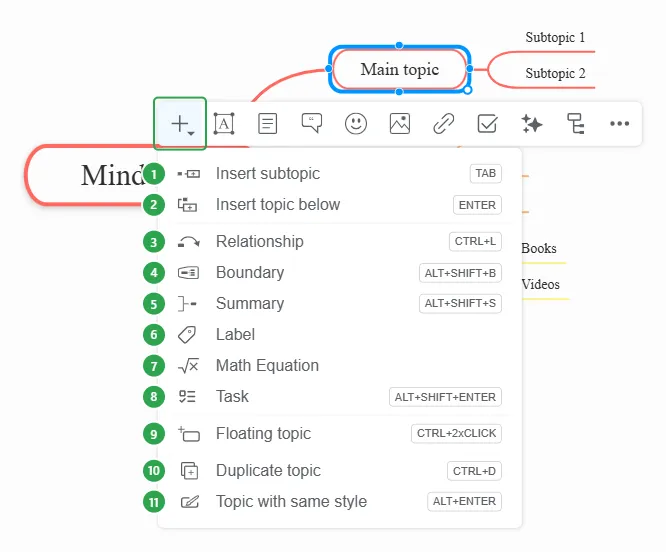
- Insert subtopic (TAB) - adds a child topic to the selected one.
- Insert topic below (ENTER) - adds a sibling right after the selected topic. It isn’t offered on the central topic.
- Relationship (CTRL+L) - draws an arrow to any other topic.
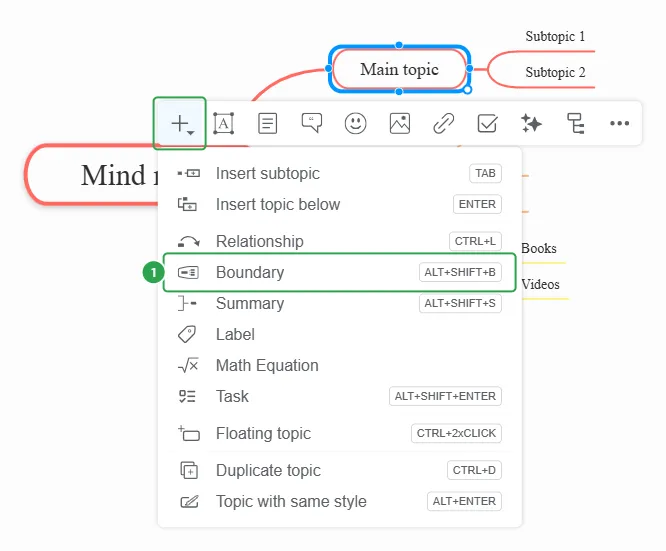
- Boundary (ALT+SHIFT+B) - draws a frame around the topic and its branch.
- Summary (ALT+SHIFT+S) - groups the branch with a bracket and adds a topic next to it where you write a conclusion.
- Label - adds a short tag at the start of the topic. You can then filter the map to show only the topics with that label.
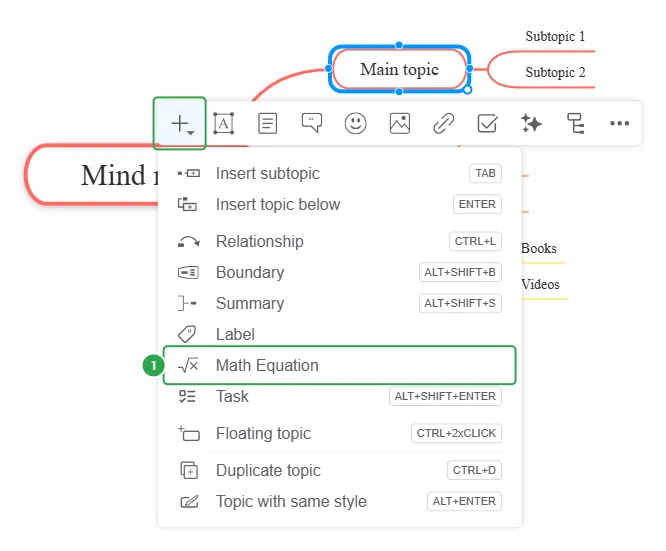
- Math Equation - adds a formula to the topic.
- Task (ALT+SHIFT+ENTER) - adds a subtopic that is already a task, with a checkbox in front of its text.
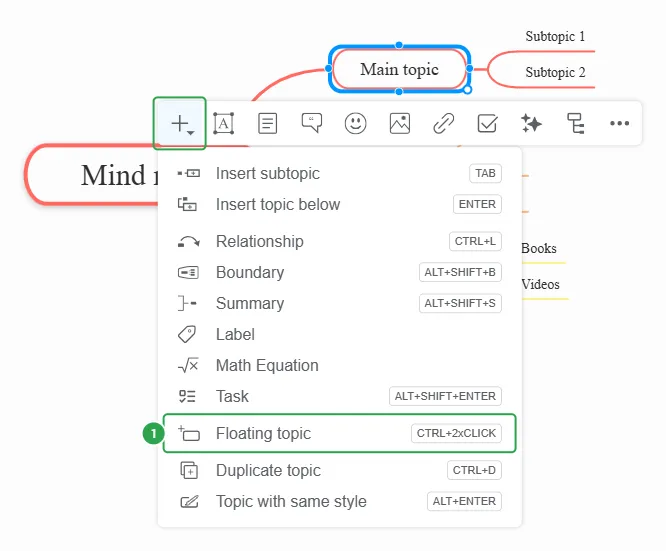
- Floating topic (CTRL+double-click on the canvas) - adds a topic that isn’t connected to any other topic.
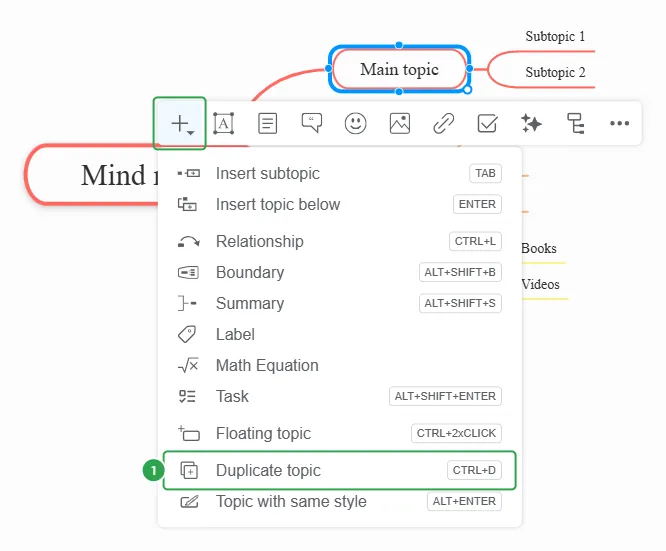
- Duplicate topic (CTRL+D) - copies the topic’s text into a new sibling.
- Topic with same style (ALT+ENTER) - adds a new sibling that looks like the selected topic.
Boundary and Summary are grayed out when the central topic is selected.
Relationships
Section titled “Relationships”A relationship is an arrow between any two topics, even ones on different branches. Select the first topic, click Insert, then Relationship (1), or press CTRL+L:
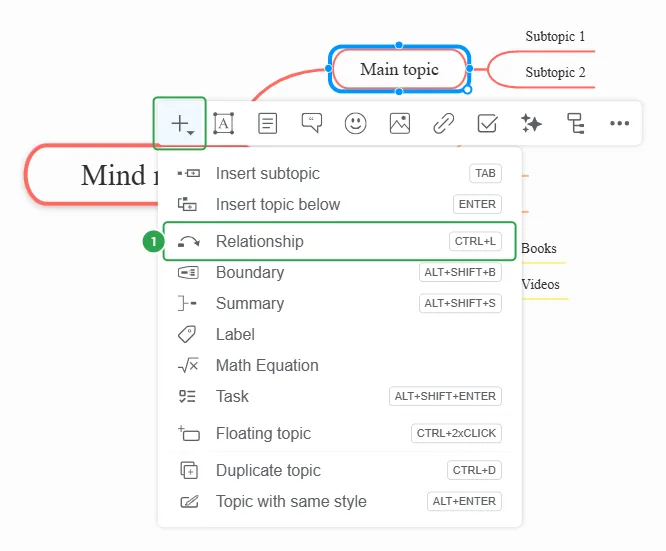
Click the topic you want to connect to. The arrow is drawn between the two topics:
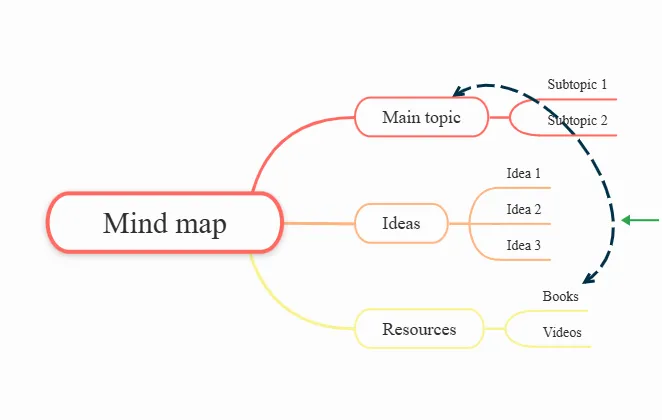
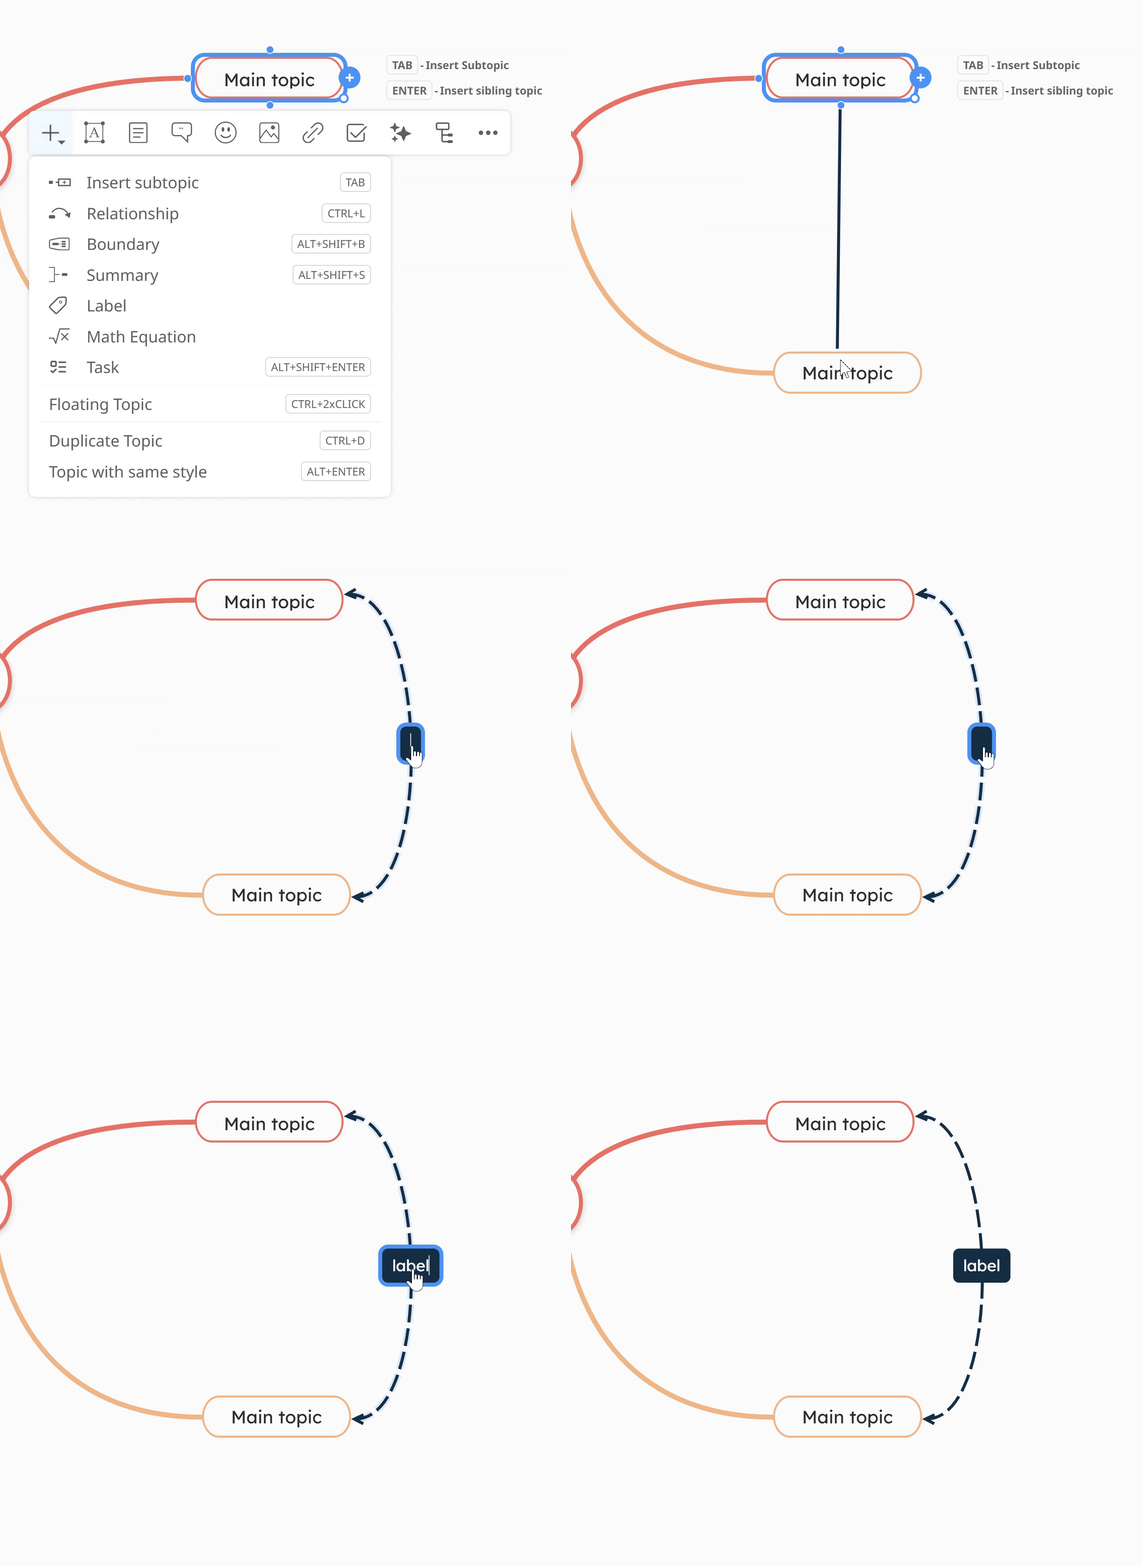
To describe how the two topics are connected, add a label to the arrow, like “causes” or “depends on”. Click the arrow and start typing. The text appears in the middle of the arrow.
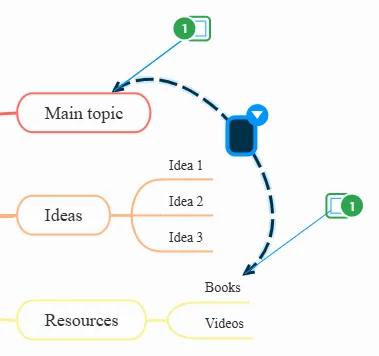
Select the relationship and drag its square handles (1) to bend the curve:
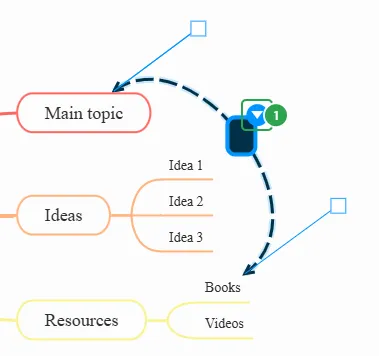
Click the small arrow (1) that appears on the selected relationship to open its menu:
The menu opens:
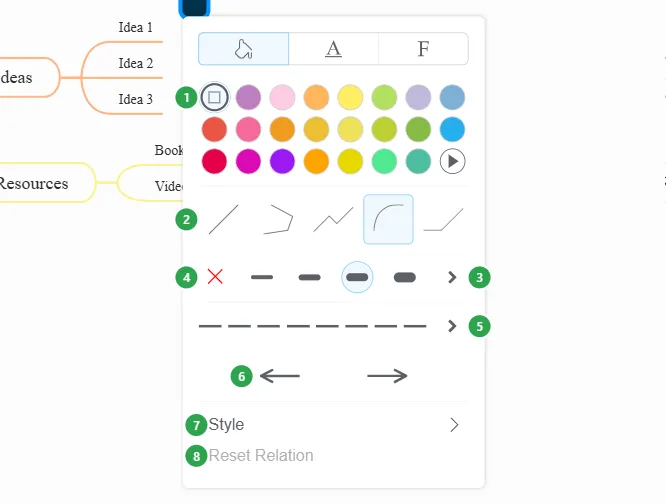
- Color - the color of the line.
- Shape - Straight Line, Arc, Zigzag, Angle or Single Angle.
- Weight - how thick the line is. The › shows more weights.
- Remove - deletes the relationship.
- Pattern - solid, dashed or dotted. The › shows more patterns.
- Line endings - the arrowheads at the left and right ends.
- Style - copies the relationship’s style, or sets it as the default for the map.
- Reset Relation - goes back to the default look.
You can also add a label from the Label Style tab (the A): click Add Label. Once the label exists, the same tab styles it:
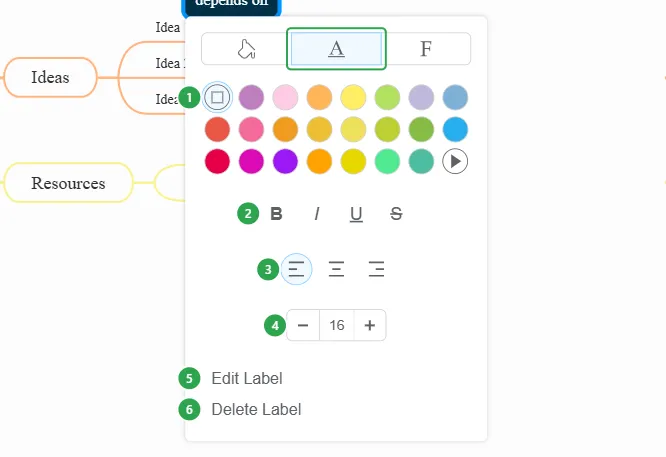
(1) text color · (2) Bold, Italic, Underline, Strikethrough · (3) alignment · (4) text size · (5) Edit Label to change the text · (6) Delete Label to remove it. To change the font, use the Label Font tab (the F).
Boundaries
Section titled “Boundaries”A boundary draws a frame around a topic and its whole branch, to group it visually. Select a topic, click Insert, then Boundary (1), or press ALT+SHIFT+B. You can’t add a boundary to the central topic.
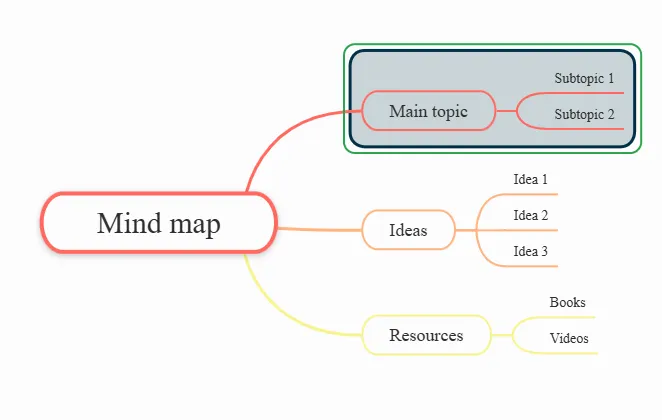
The frame is drawn around the topic and all its subtopics:
Drag the boundary’s handles to stretch it over neighboring branches. You can also put a boundary inside another boundary.
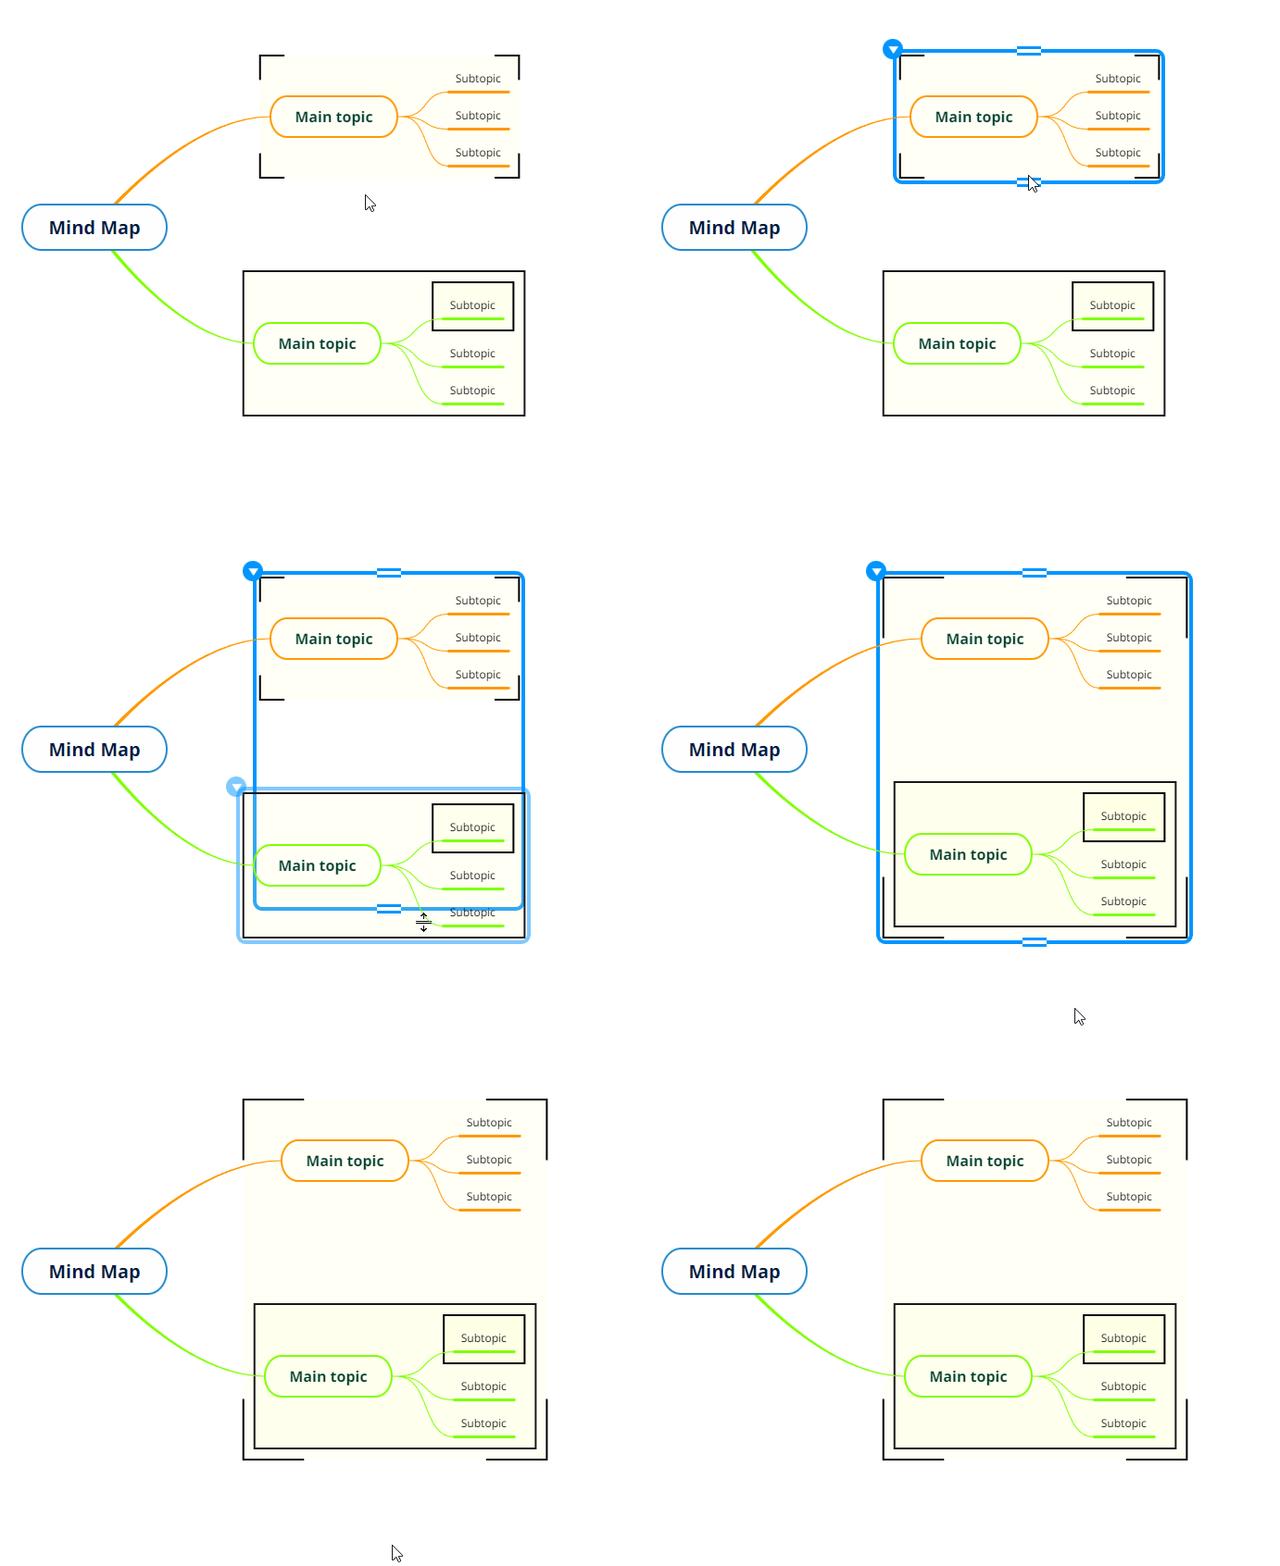
To customize the boundary, select it and click the round button at its top-left corner. The menu has four tabs.
Fill:
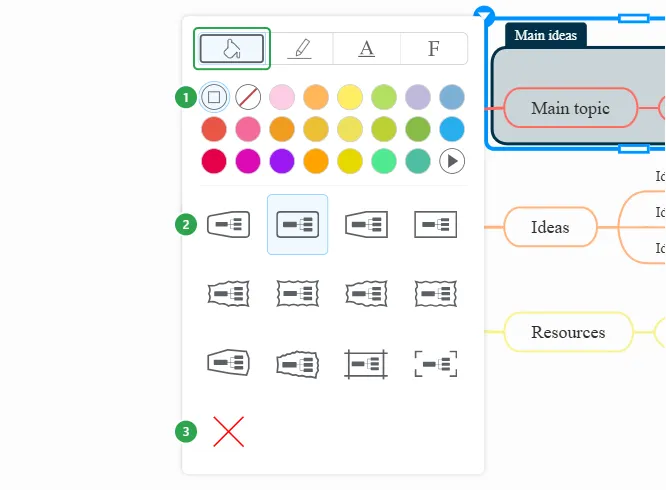
- Fill color, including transparent.
- Boundary type, such as Rounded Rectangle, Straight Line, Rectangle, Tension, Wave, Convex Wave, Rectangle Crossed or Focused.
- Remove the boundary.
Stroke:
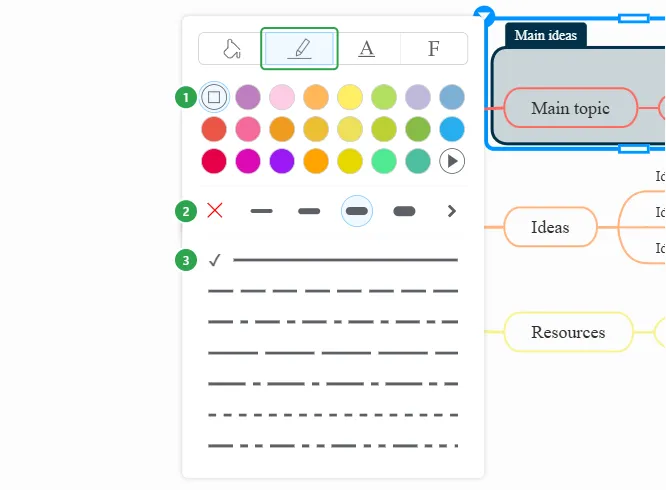
- Border color.
- Border weight. The red X removes the border.
- Border pattern.
Label Style - to explain why you grouped these topics, give the boundary a title: click Add Label. Then style it here:
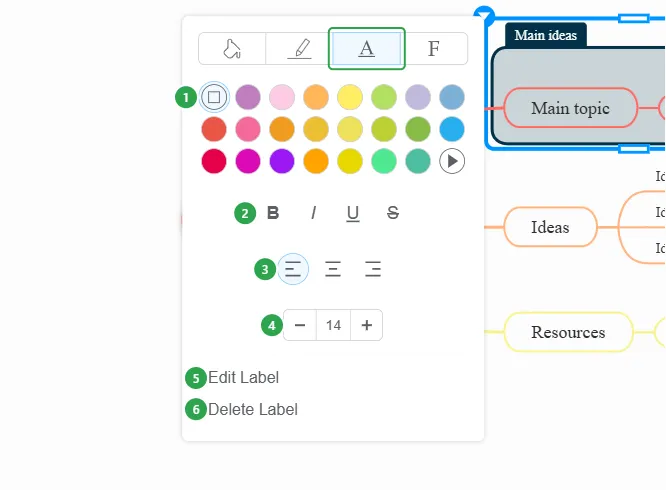
(1) color · (2) Bold, Italic, Underline, Strikethrough · (3) alignment · (4) text size · (5) Edit Label (puts the label in edit mode so you can type) · (6) Delete Label.
Label Font - search for a font (1) or pick one from the list (2):
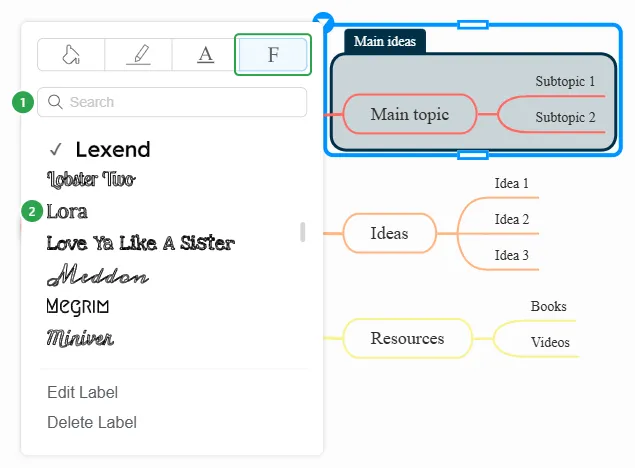
Summaries
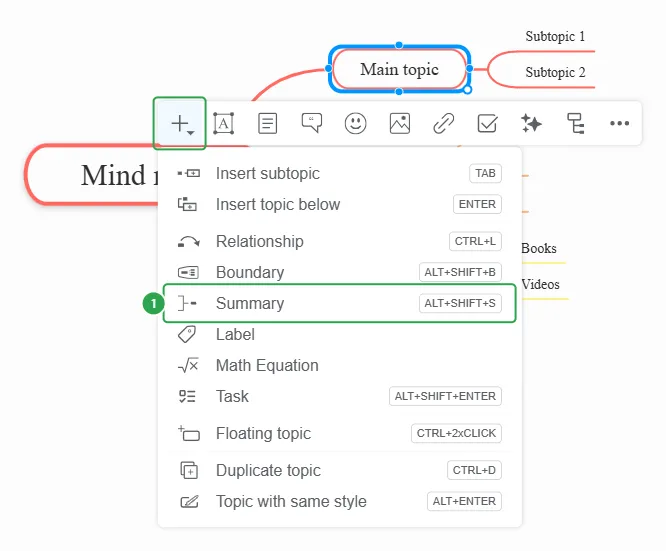
Section titled “Summaries”A summary adds a bracket after a branch, with a new topic where you write the conclusion. Select a topic, click Insert, then Summary (1), or press ALT+SHIFT+S. You can add a summary to any topic but the central one.
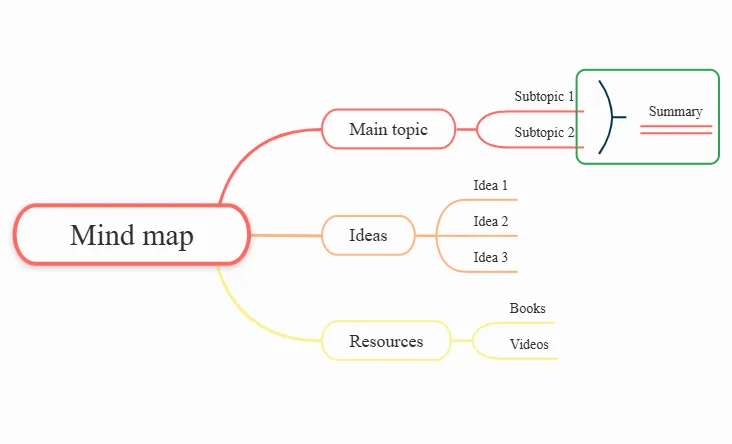
The bracket and a Summary topic appear after the branch. The summary topic is a normal topic: type in it and style it like any other.
Use the handles to stretch the summary over more siblings:

To customize the bracket, select it and click its menu button:
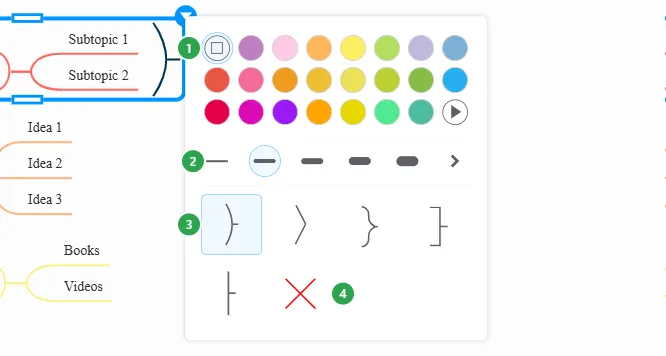
- Color.
- Weight.
- Type: Curve, Angle, Bight (Brace), Elbow or Straight.
- Remove the summary.
Labels
Section titled “Labels”A label is a tag you add to topics to group them, for example by status or theme. Add the same label to several topics, then filter the map to see only those topics. Topic labels are different from the labels on relationships and boundaries, which are just text that describes the arrow or the frame.
To add a label, select a topic, click Insert, then Label (1):
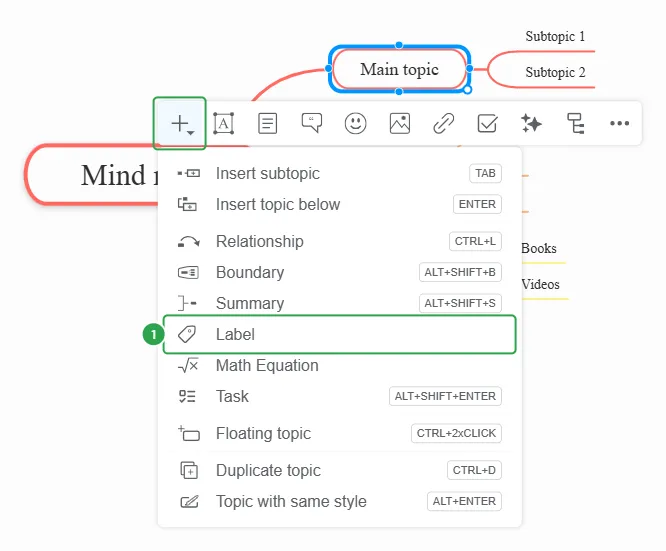
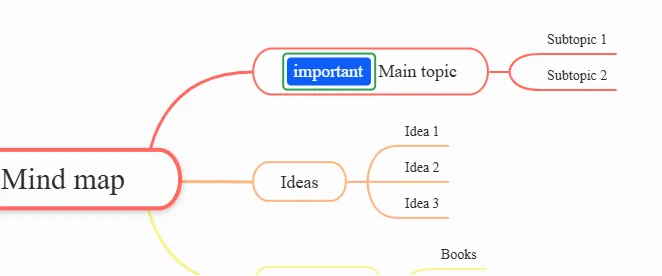
Type the label’s name and press ENTER. The label appears at the start of the topic:
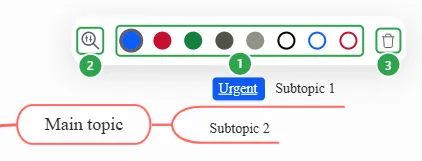
Hover a label to change its color (1), show only the topics with this label (2) or delete it (3). Deleting a label keeps its name in the topic as plain text:
Labels you’ve already used are suggested as you type, so you can quickly add the same label to other topics. To see only the topics with a given label, see Filter by Label.
Math Equations
Section titled “Math Equations”Select a topic, click Insert, then Math Equation (1):
A default formula is added to the topic. Press ENTER and Mindomo shows the formula inside the topic:
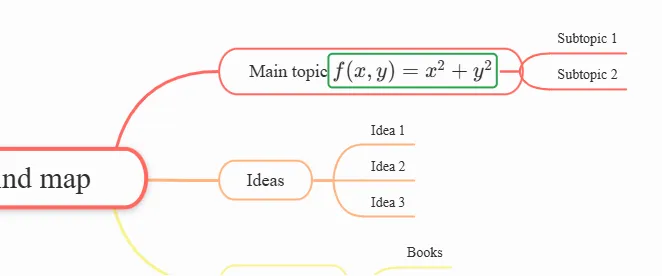
Formulas are written in KaTeX, a widely used syntax for math notation (for example, \frac{a}{b} for a fraction). Read more about writing and editing formulas in Math Formulas.
Floating Topics
Section titled “Floating Topics”A floating topic isn’t connected to the rest of the map, so you can place it anywhere. Click Insert, then Floating topic (1), and click the spot on the canvas where you want it:
The floating topic appears where you clicked:
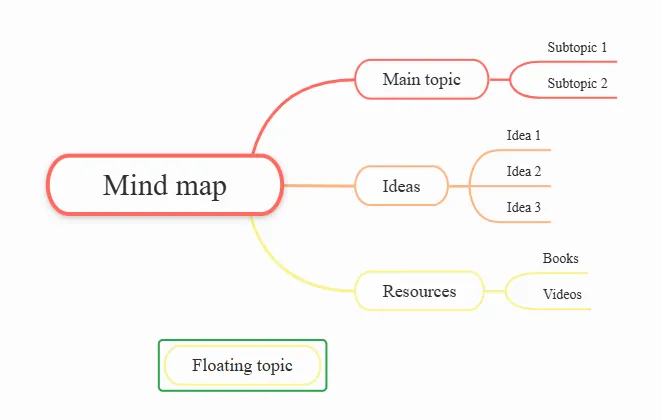
You can also CTRL+double-click on the canvas, or right-click the canvas and choose Floating topic. To turn a connected topic into a floating one, use More > Detach Topic (see More Actions).
Duplicate Topics
Section titled “Duplicate Topics”Duplicate topic (CTRL+D) copies the selected topic’s text into a new sibling below it. Its subtopics aren’t copied. Select a topic, click Insert, then Duplicate topic (1):
The copy appears as the next sibling and takes its branch color from the map’s theme:
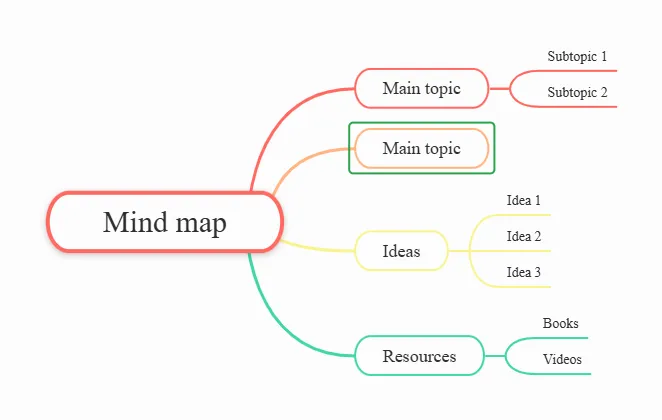
The central topic has no siblings, so duplicating it adds a floating topic instead.
Topic with same style (ALT+ENTER) works the other way round: it adds a new, empty sibling that has the same look as the selected topic, ready for you to type.
Click Style on the toolbar to change the look of the selected topic or topics. The panel has four tabs. To style the whole map at once, use Themes instead.
Text Style
Section titled “Text Style”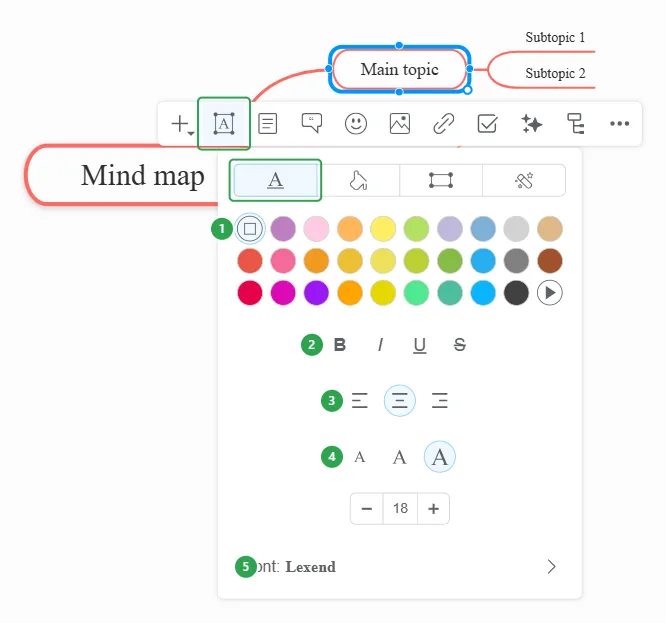
- Font color - the color of the topic text.
- Bold, Italic, Underline and
Strikethrough. - Alignment - left, center or right.
- Size - Small, Normal or Large, or set the exact size with - and +.
- Font - pick a font family.
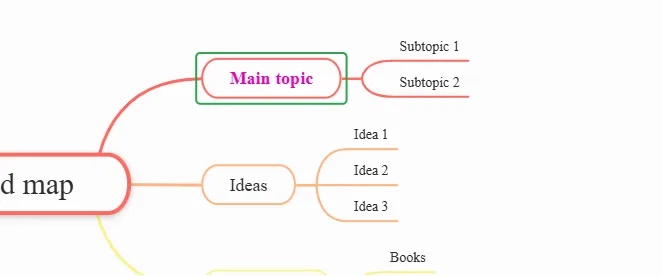
For example, Bold with a magenta font color:
Topic Background
Section titled “Topic Background”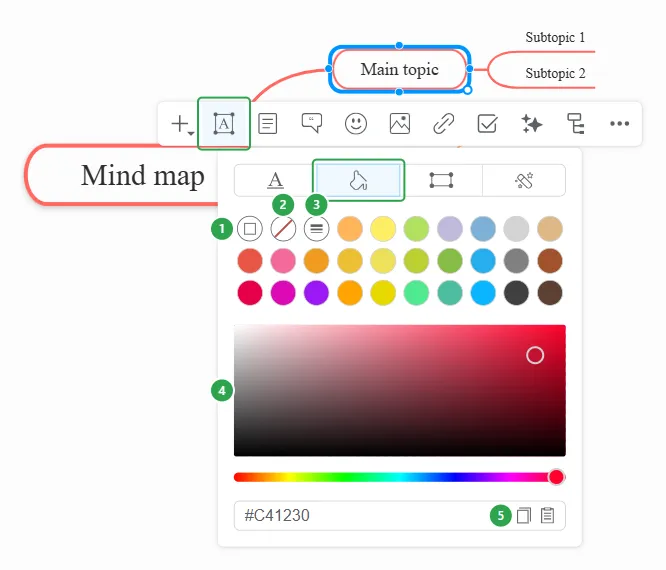
- Default - From Theme - the fill color the theme gives this topic.
- Transparent - no fill, only the outline.
- Line Color - fills the topic with the color of the line that connects it to its parent, so the branch reads as one color.
- Color picker - choose any color.
- Copy / Paste - copy a color’s hex code, or paste one in.
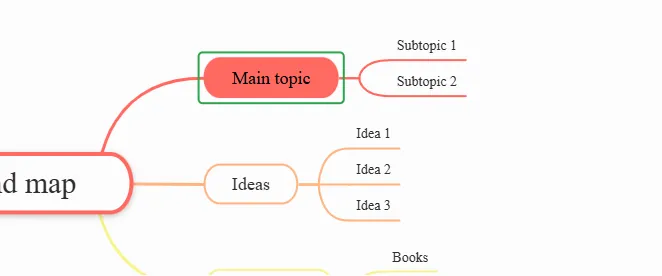
For example, Line Color fills Main topic with its red branch color:
Topic Shape
Section titled “Topic Shape”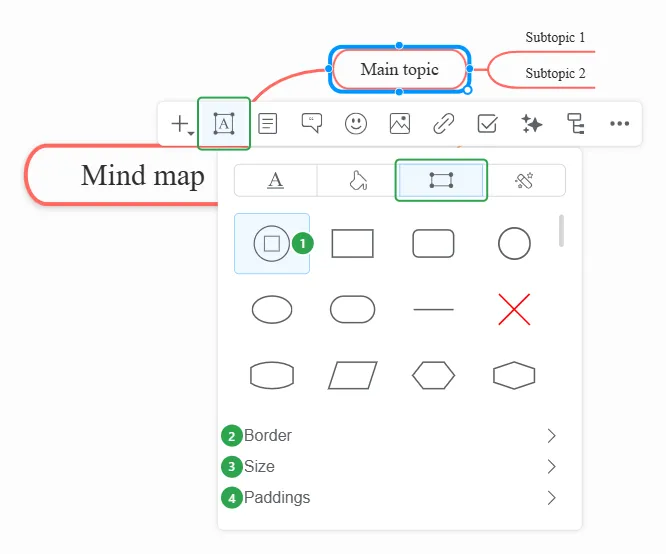
- Shape - more than 50 shapes, from rectangles and capsules to clouds, arrows and brackets.
- Border - border color and weight.
- Size - width and height.
- Paddings - the space between the text and the border.
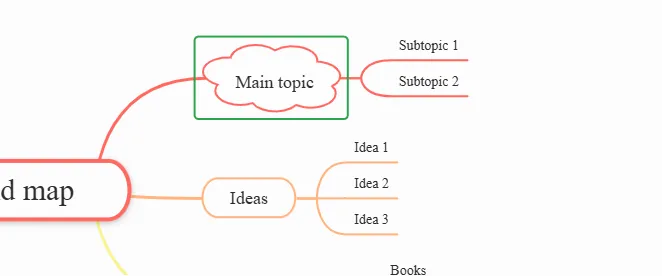
For example, the Cloud shape:
Click Border, Size or Paddings to open its options next to the panel.
Border:
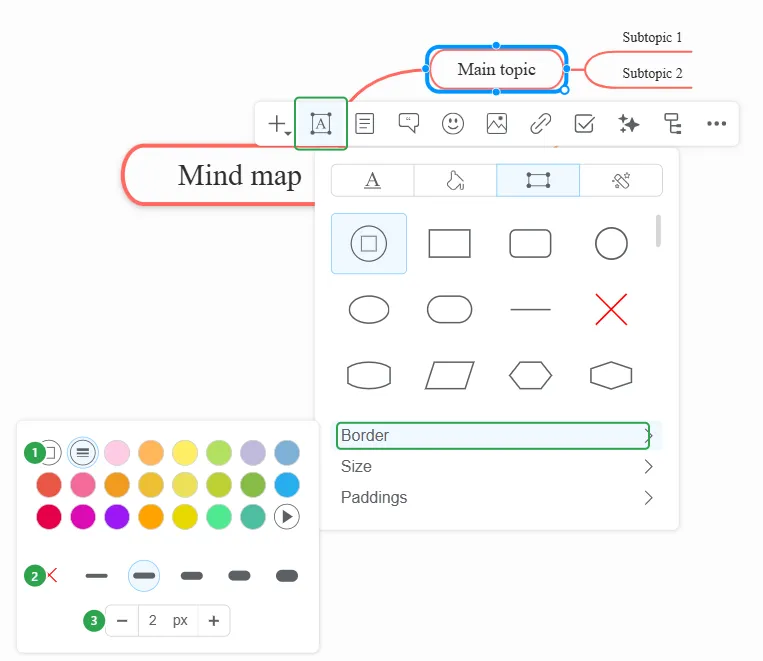
- Border color.
- Border weight. The red X removes the border.
- Exact weight in pixels.
Size:
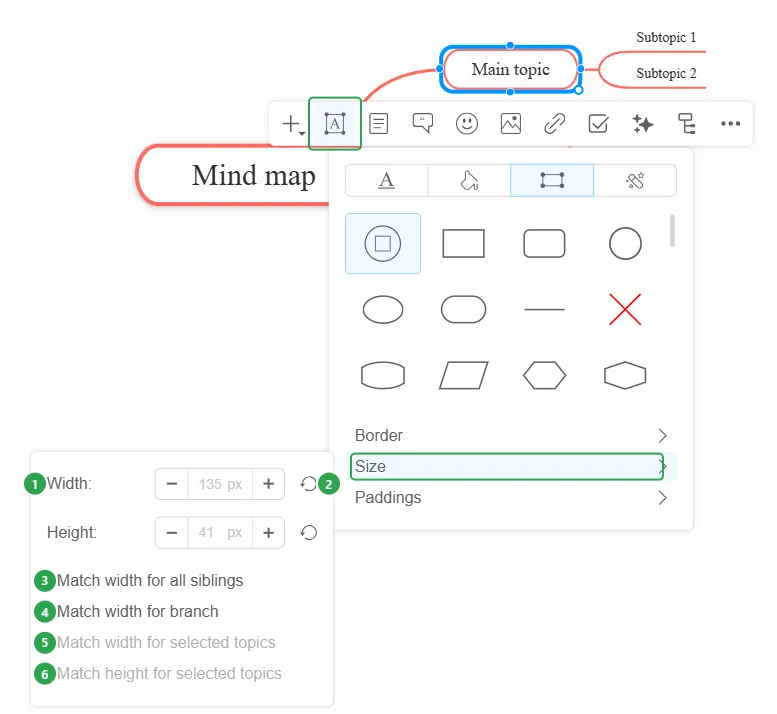
- Width and Height in pixels.
- Reset the width (the arrow next to Height resets the height).
- Match width for all siblings - resizes the topics on the same level so they are as wide as the selected topic.
- Match width for branch - resizes every topic that branches out from the selected topic to match its width.
- Match width for selected topics - available when several topics are selected.
- Match height for selected topics - available when several topics are selected.
Paddings:
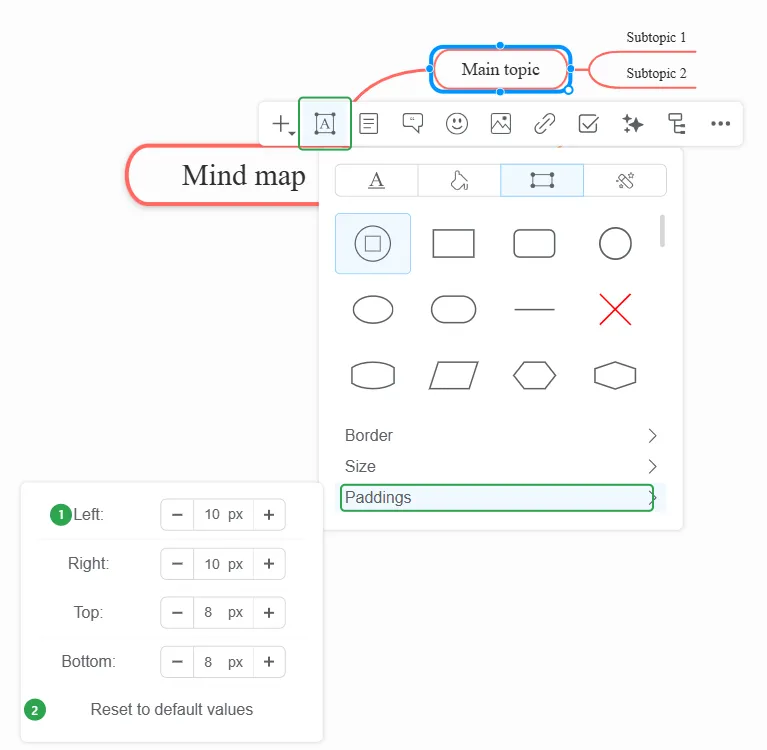
- Left, Right, Top and Bottom padding - the empty space, in pixels, between the topic’s text and each side of its border. Type a value or use - and +. Larger paddings make the topic bigger around the same text; smaller ones make it fit the text more tightly.
- Reset to default values - restores the default paddings (in the example above, 10 px left and right, 8 px top and bottom).
Topic Style
Section titled “Topic Style”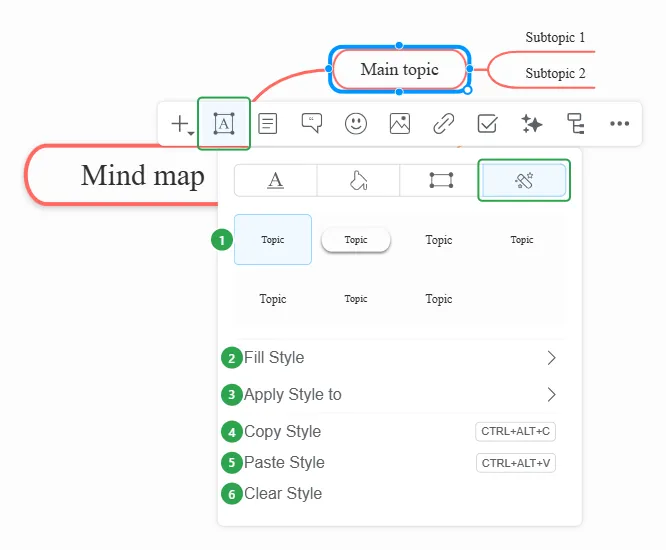
- Predefined styles - ready-made looks; click one to apply it. The list also shows styles you’ve already used: in this map, your custom style (at the top) and styles from your own themes (at the bottom).
- Fill Style - fills the topic with a solid color or a gradient. Pick the color itself on the Background tab.
- Apply Style to - copies this topic’s style to other topics.
- Copy Style (CTRL+ALT+C).
- Paste Style (CTRL+ALT+V).
- Clear Style - removes the topic’s custom style.
Apply Style to lets you choose which topics get the style:
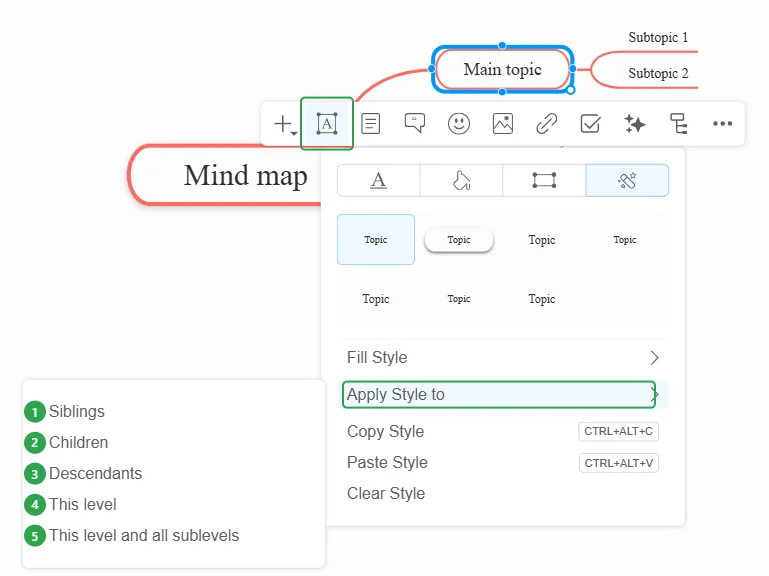
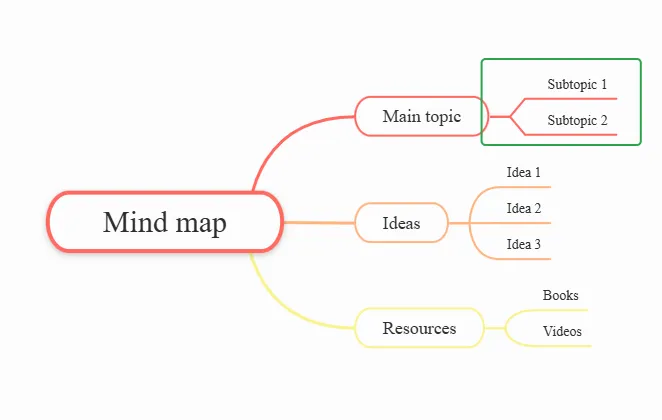
The examples in parentheses refer to the map in the picture under this list:
- Siblings - topics with the same parent (for Subtopic 1: Subtopic 2).
- Children - topics directly under it (for Main topic: Subtopic 1 and 2).
- Descendants - all topics under it, at any depth.
- This level - all topics at the same level, on any branch (for Subtopic 1: all the subtopics).
- This level and all sublevels - this level plus everything under it (for Main topic: every topic except the central one).
For example, a predefined style applied to Siblings gives Main topic, Ideas and Resources the same look:
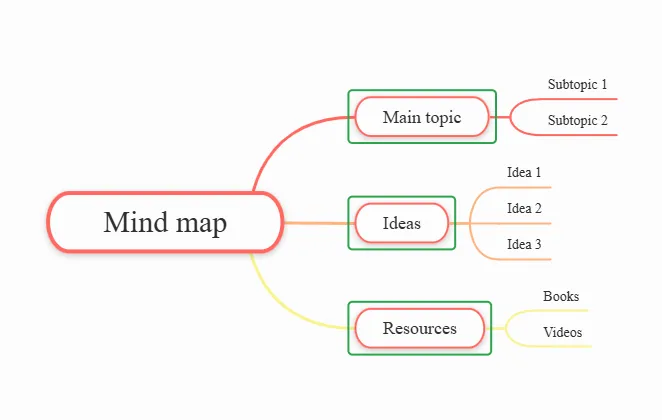
Diagram Background
Section titled “Diagram Background”Right-click an empty spot on the canvas:
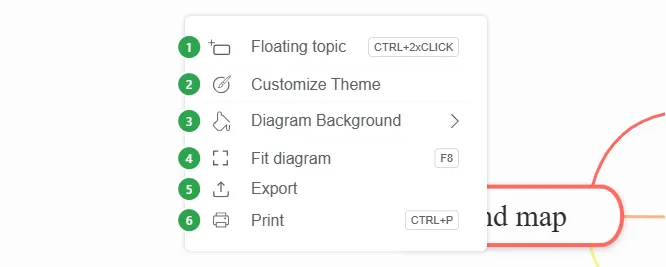
- Floating topic - adds a floating topic where you clicked.
- Customize Theme - opens the theme editor. See Themes.
- Diagram Background - see below.
- Fit diagram (F8) - zooms to fit the whole map.
- Export - see Exporting.
- Print (CTRL+P).
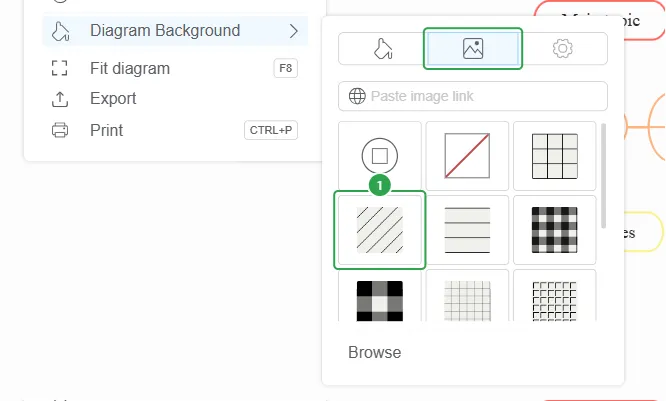
Diagram Background has three tabs, Color, Image and Settings, covered in Map background customization. On the Image tab, pick a pattern (1), paste an image link, or click Browse to use your own image:
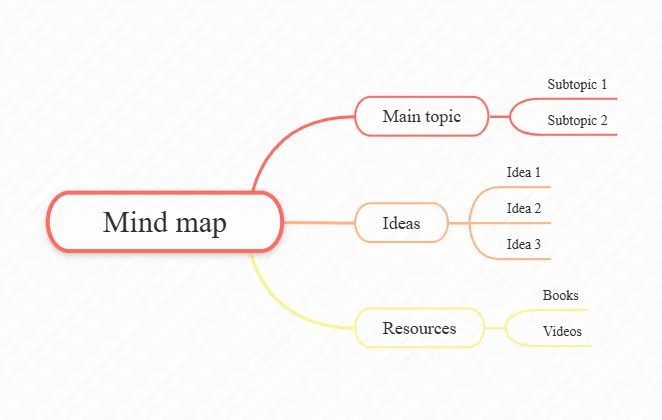
The pattern fills the canvas behind the map:
The Settings tab is grayed out until the map has a background pattern or image, because its options only apply to one. Once you add one, open Settings to adjust it:
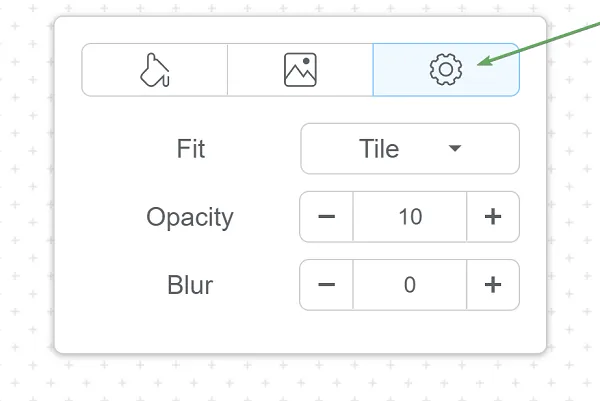
- Fit - how the image fills the canvas, for example Tile (repeated across the canvas), Cover or Center.
- Opacity - how strongly the image shows. Click - or +; lower values make it fainter, so the map stays easy to read on top of it.
- Blur - softens the image. 0 keeps it sharp; higher values blur it more.
Notes hold longer text that would crowd the topic. To read a topic’s note without opening it, hover over the topic. To add or edit a note, select a topic and click Notes, or press SHIFT+F2:
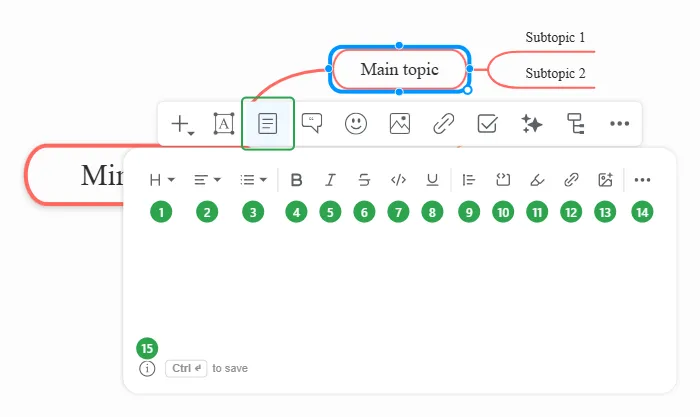
Most buttons format the text you selected, or the paragraph your cursor is in:
- Heading - turns the paragraph into a heading. Pick a size from the dropdown; use headings to split a long note into sections.
- Align - lines the paragraph up on the left, in the center, on the right, or justified (stretched to both edges).
- List - starts a bullet list, a numbered list or a task list. A task list has a checkbox in front of each item that you can tick off.
- Bold - makes the selected text bold, for words that should stand out.
- Italic - makes the selected text italic, for emphasis or titles.
- Strikethrough - draws a line through the selected text (
like this), for example to show something is done or no longer valid. - Code - shows the selected text in a monospaced
codefont. Use it for short commands, file names or values inside a sentence. - Underline - underlines the selected text.
- Blockquote - indents the paragraph with a bar on its left, to set apart a quote or a remark.
- Code Block - puts the paragraph in a separate box with a monospaced font, for several lines of code. Spaces and line breaks are kept as you type them.
- Color - changes the color of the selected text.
- Links - turns the selected text into a link. Enter the web address it should open.
- Images - inserts an image into the note.
- More - six more options (see below).
- The ⓘ opens the formatting dialog (see below).
Press CTRL+ENTER to save the note.
More shows six more options:
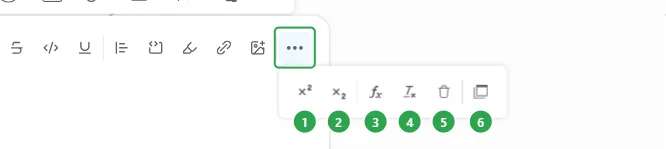
- Superscript - raises the selected text above the line, as in x2 or 1st.
- Subscript - lowers the selected text below the line, as in H2O.
- Math Formulas - inserts a mathematical formula, such as a fraction or an equation, into the note.
- Clear Style - removes all formatting from the selected text and leaves it as plain text. The text itself stays.
- Clear All - deletes everything in the note, text and formatting.
- Move Panel - changes where the notes editor opens: a Side Panel at the edge of the screen, a Center Overlay in the middle of the screen, or a Popup Panel next to the topic (the default). Your choice is remembered for next time.
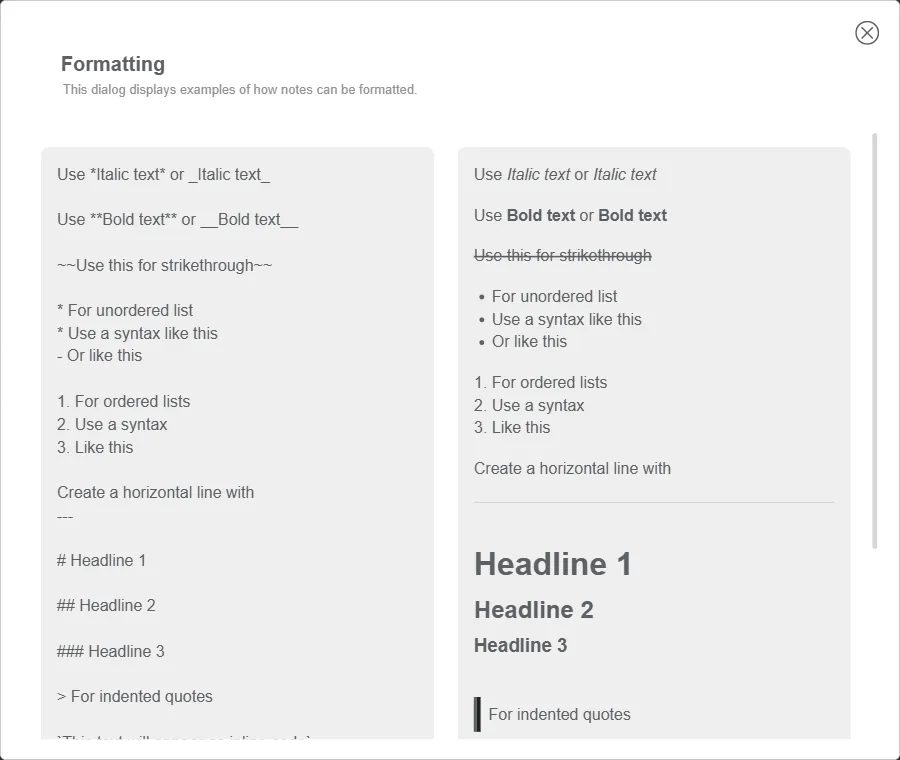
The ⓘ opens a Formatting dialog. It shows how to format notes by typing Markdown-style syntax (asterisks, # headings, lists, quotes, code), next to how each one looks:
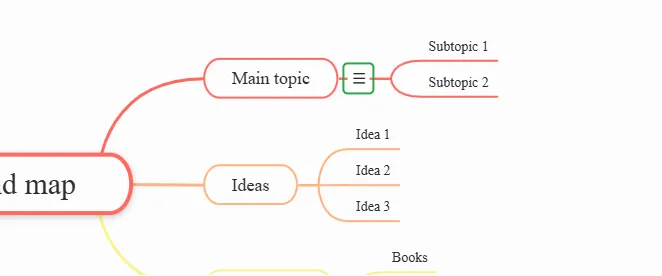
A topic with notes shows a notes icon next to it. Click the icon to open the notes again:
Comments
Section titled “Comments”Comments are for discussing a topic with your collaborators. Select a topic and click Comments, or press SHIFT+F9:
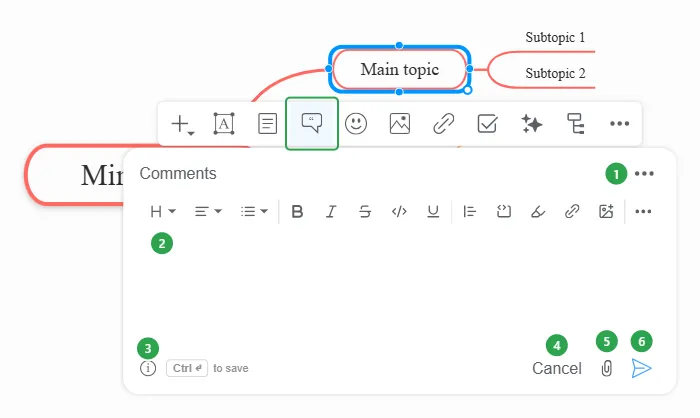
- Move Panel - Side Panel, Center Overlay or Popup Panel (the default).
- The editor toolbar, the same as in Notes.
- The ⓘ opens the comment formatting dialog.
- Cancel - discards the comment.
- Attach files - or paste an image from your clipboard.
- Save comment - or press CTRL+ENTER.
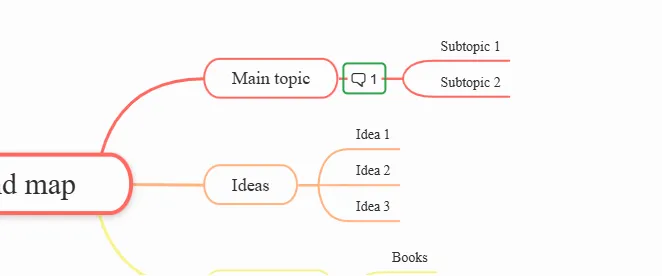
A topic with comments shows a comment icon and the number of comments. Click it to open the thread, where you can reply. Hover a comment to Edit or Delete it.
In the Side Panel view, the panel also shows the topic’s details, so you can turn the discussion into action without leaving the comments:
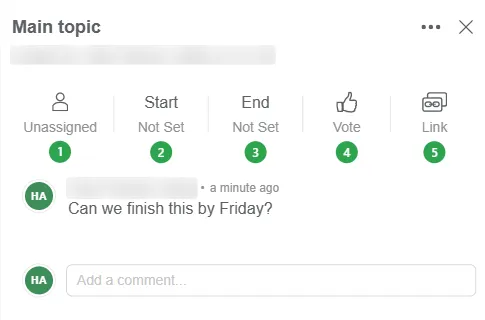
- Unassigned - assigns the topic to a person, which turns it into a task for them. Click it and pick one of the people you share the map with. The label changes from Unassigned to the person’s name. See Tasks.
- Start - sets the date when work on the topic begins. It shows Not Set until you pick a date.
- End - sets the date when the topic should be done, its deadline. It also shows Not Set until you pick a date. The start and end dates are the same ones you set from Task.
- Vote - adds your vote to the topic, for example to show you agree with an idea or to help the team choose between options. A thumbs-up and the number of votes show next to the topic, so everyone can see which topics got the most support.
- Link - copies a link to this topic. Anyone who opens it sees the map with the topic highlighted. See Copy Link to Topic.
Icons and Emojis
Section titled “Icons and Emojis”Select a topic and click Icons, or press SHIFT+F5:
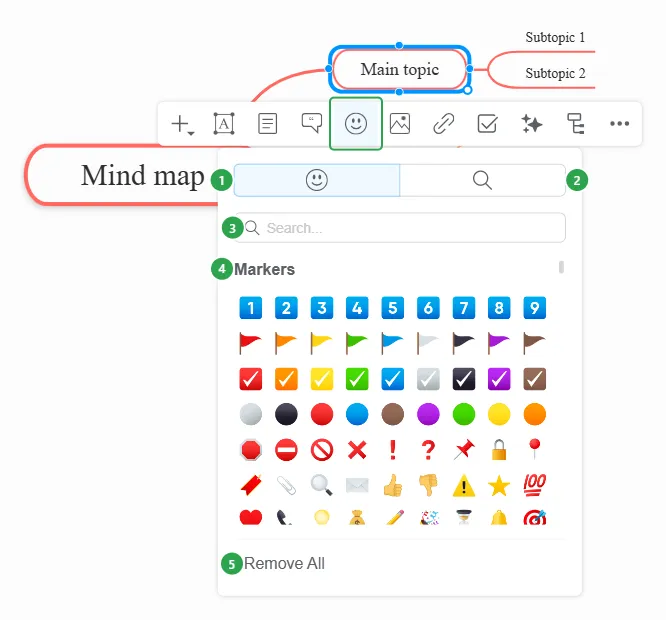
- Icons - Mindomo’s icons and emojis.
- Search web icons - search for icons on the web.
- Search - find an icon by name.
- Categories - Markers, Letters & Numbers, Smileys & People, Food, Travel, Activity, Flags, Nature, Symbols and Objects.
- Remove All - removes every icon from the topic.
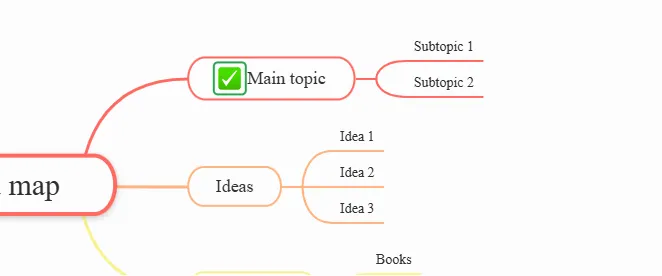
Click an icon to add it. It goes at the start of the topic text:
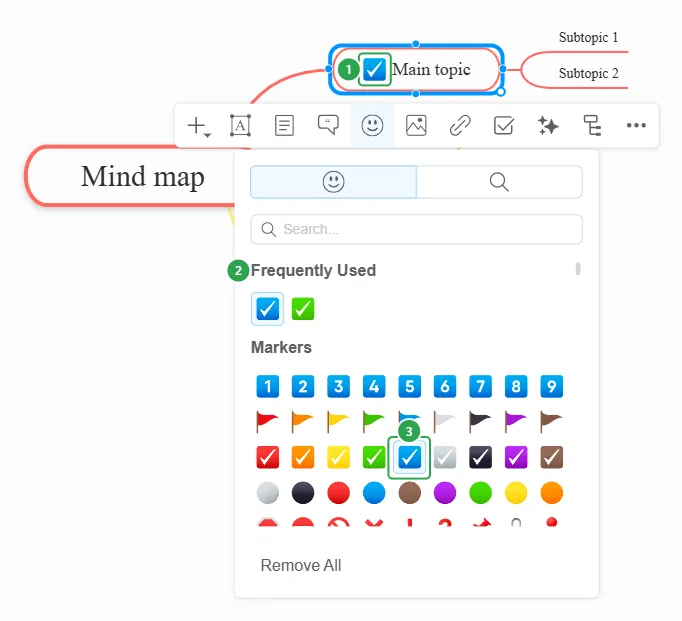
To change the icon, click it in the topic (1). The Icons panel opens with the Frequently Used icons at the top (2) and the current icon highlighted (3). Click another icon to replace it, or Remove All to remove it.
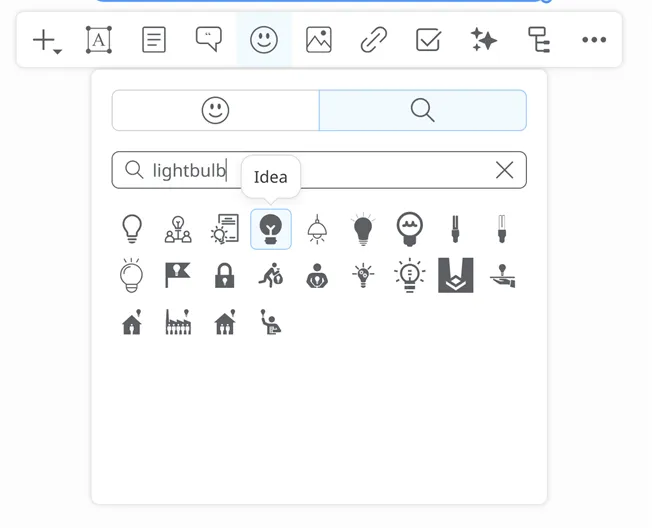
Can’t find the right icon? Click Search web icons (2), type what you’re looking for, and click an icon to add it. Hover an icon to see its name:
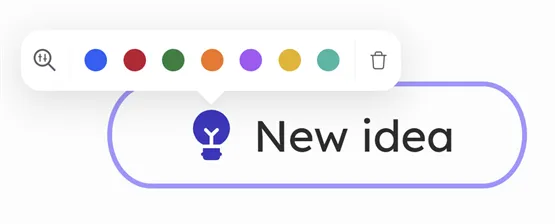
Once a web icon is in the topic, hover it and click a color to recolor it:
Multimedia
Section titled “Multimedia”Select a topic and click Multimedia to add an image, a video or an audio file. The panel has three tabs: Add image, Add video and Add audio or record. You can also drag & drop files or copy & paste links directly into topics.
Images
Section titled “Images”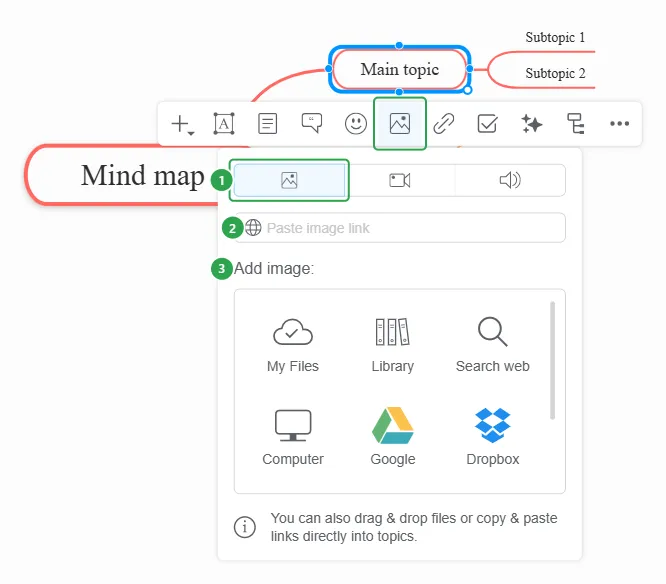
- Add image tab.
- Paste image link - paste the address of an image on the web.
- Add image from: My Files (files already uploaded to your account), Library (Mindomo’s image gallery), Search web, Computer, Google, Dropbox or OneDrive.
Web search results come from the internet, so check that you are allowed to use the image.
For example, an image from the Library appears above the topic text:
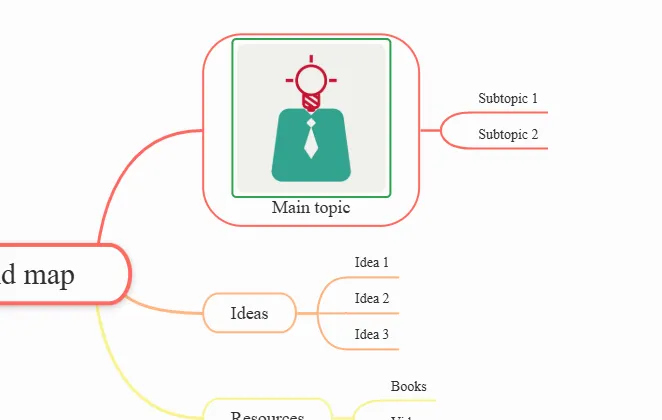
Click the image, then the small arrow at its top, to change how it sits in the topic:
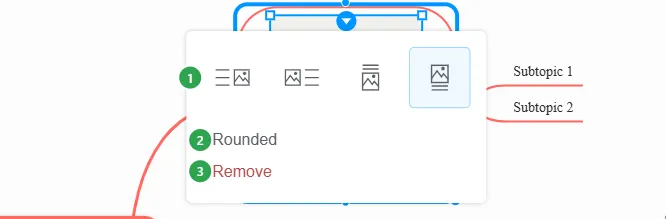
- Position - the image to the right, left, below or above the text.
- Rounded - rounds the image’s corners.
- Remove - deletes the image.
Drag the image’s corner handles to resize it.
Videos
Section titled “Videos”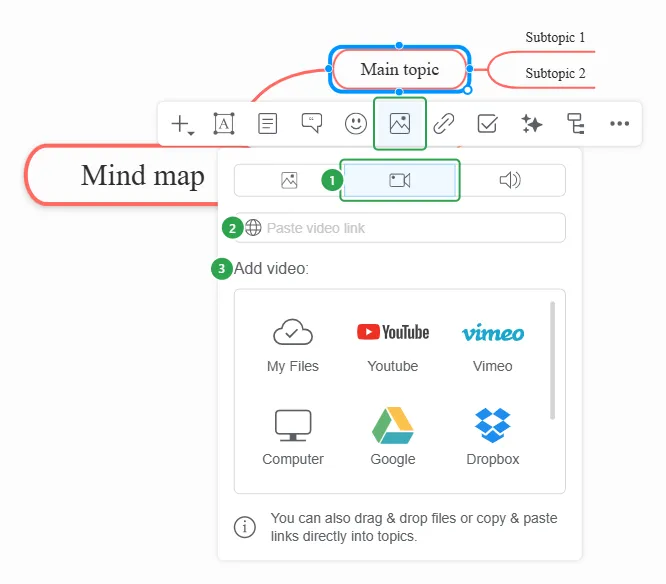
- Add video tab.
- Paste video link.
- Add video from: My Files, Youtube, Vimeo, Computer, Google, Dropbox or OneDrive. Youtube and Vimeo open a search box.
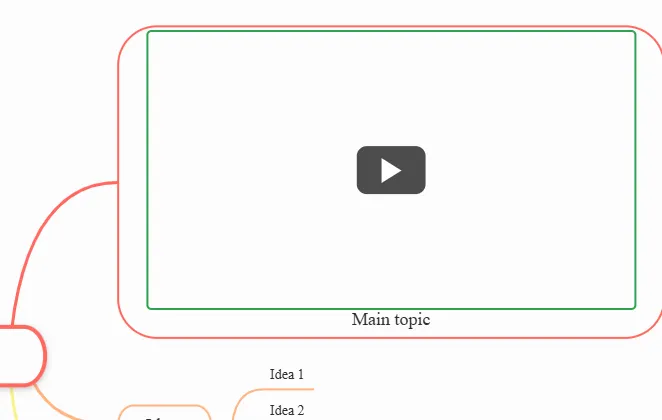
The video shows in the topic with a play button:
Audio Recordings
Section titled “Audio Recordings”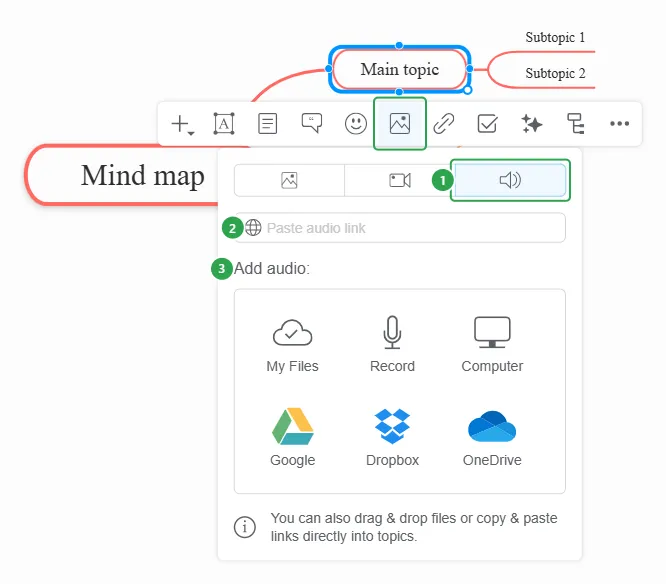
- Add audio or record tab.
- Paste audio link.
- Add audio from: My Files, Record, Computer, Google, Dropbox or OneDrive.
Record opens the Sound Recorder, where you record an audio note straight into the topic. Your browser asks for access to your microphone first.
Links and Attachments
Section titled “Links and Attachments”Select a topic and click Links / Attachments, or press SHIFT+F3:
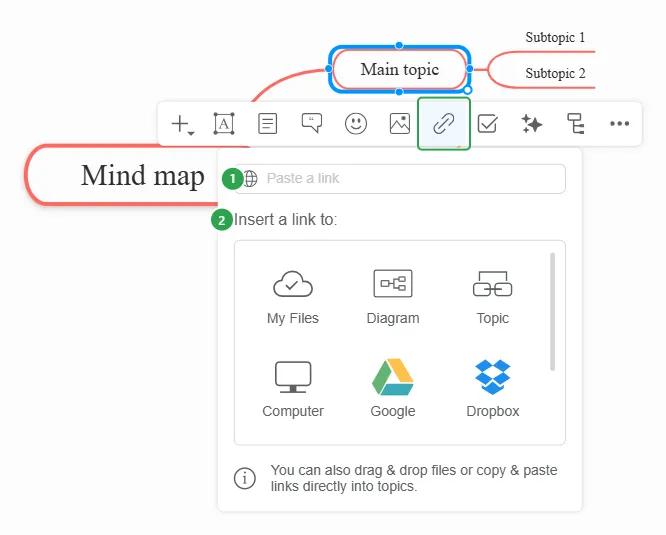
- Paste a link - paste a web address and press ENTER.
- Insert a link to:
- My Files - a file already uploaded to your account.
- Diagram - another of your maps.
- Topic - another topic in this map.
- Computer, Google, Dropbox or OneDrive - upload a new file.
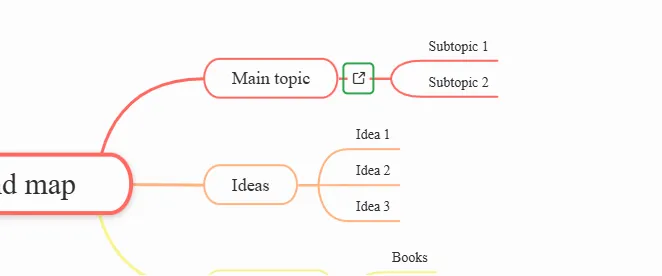
A topic with a link shows a link icon. Click the icon to open the link:
To change or remove a link, open Links / Attachments again and hover the link. Click the pencil to edit it (1) or the trash can to remove it (2):
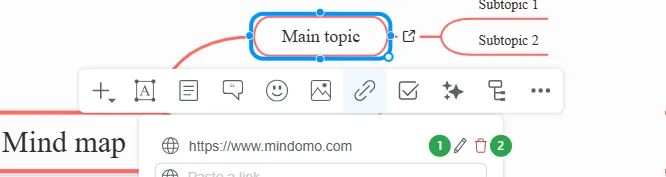
A topic can hold several links. See Multiple Hyperlinks.
To choose how links show on topics, open ☰ > Properties > Advanced:
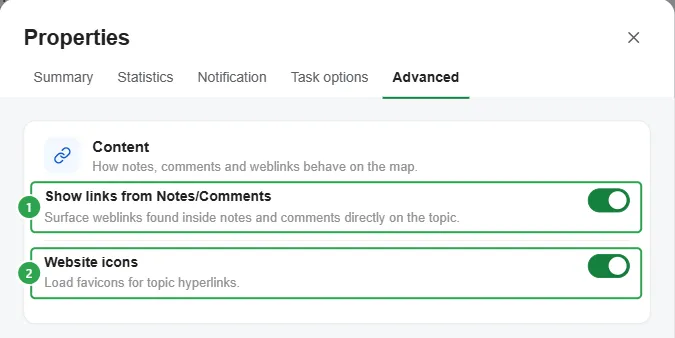
- Show links from Notes/Comments - web links you put in a topic’s notes or comments also show on the topic.
- Website icons - shows the website’s icon (favicon) for web links on topics.
These settings apply only to this map. To choose the defaults for new maps, see My account. For the other Properties settings, see Advanced Settings.
Select a topic and click Task to turn it into a task and set its details:
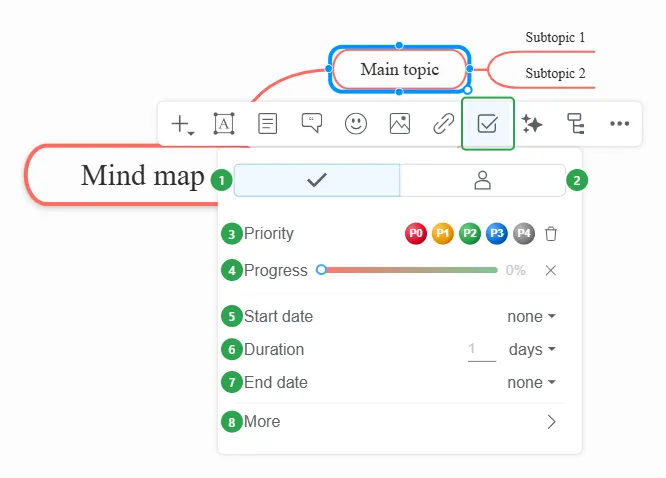
- Task info tab - the task’s details: priority, progress and dates (items 3 to 8). This tab opens first.
- Assign task tab - assigns the task to one or more people: collaborators on the map, or ghost users you add by name, who don’t need a Mindomo account. Assigned tasks can then be filtered by assignee.
- Priority - how important the task is, from P0 to P4. Click a level to set it; the trash can removes the priority.
- Progress - how much of the task is done, from 0% to 100%. Drag the slider to update it; the X resets it. If the task has subtasks, the progress can be calculated from theirs (see Roll up Subtasks).
- Start date - when work on the task begins. It shows none until you pick a date.
- Duration - how long the task takes. Type a number and choose minutes, hours or days from the list. Mindomo uses it to calculate the end date.
- End date - when the task is due. It is calculated from the start date and the duration, or you can pick it yourself, and then the duration is updated to match.
- More - opens more task fields.
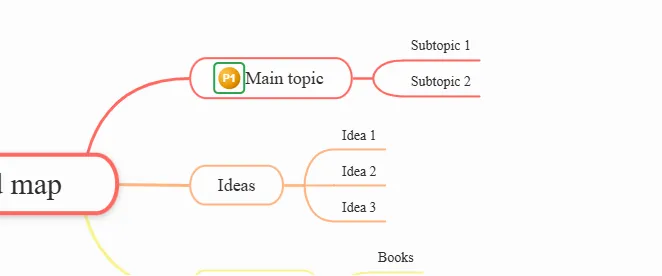
The priority shows at the start of the topic:
To manage tasks, see Task Management.
Smart Tools
Section titled “Smart Tools”Click Smart Tools on the toolbar. The panel has three tabs.
Mindomo AI
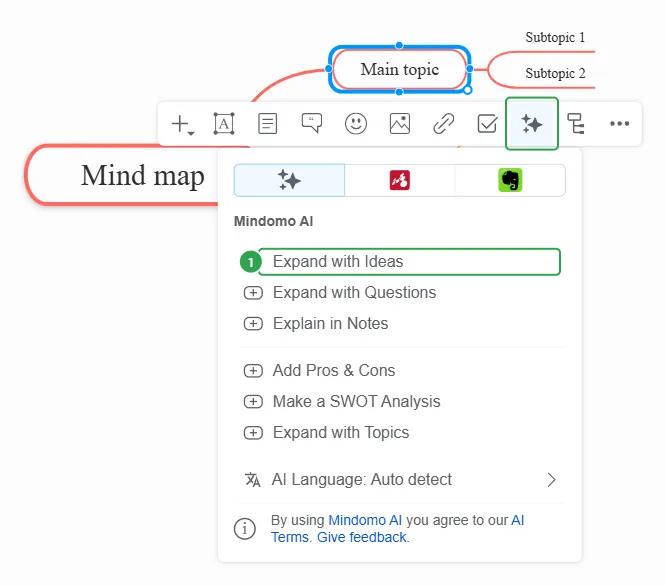
Section titled “Mindomo AI”The Generate content with AI tab lists Expand with Ideas, Expand with Questions, Explain in Notes, Add Pros & Cons, Make a SWOT Analysis and Expand with Topics, plus the AI Language setting. For example, select Main topic and click Expand with Ideas (1):
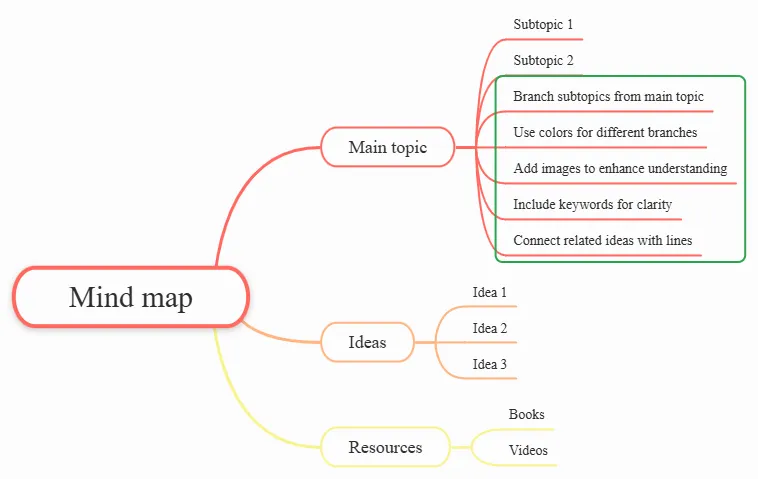
Mindomo AI adds new subtopics under the selected topic:
The other actions are described in Mindomo AI.
Mindomo Bookmarks
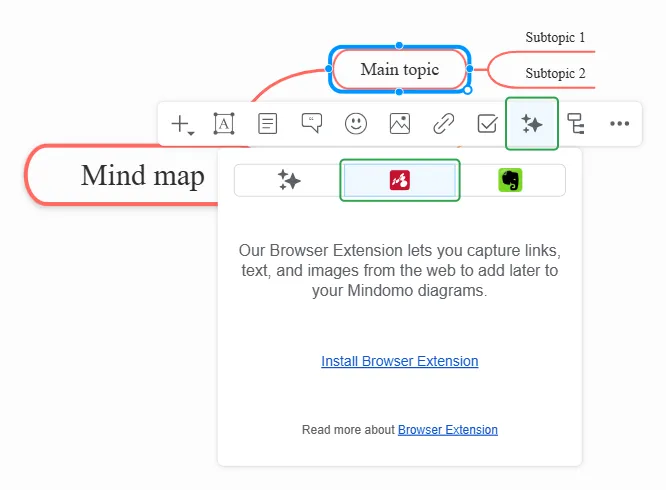
Section titled “Mindomo Bookmarks”The Mindomo Bookmarks tab shows the text, links and images you saved from web pages with the Mindomo - AI Mind Map Maker browser extension (for Chrome, Edge and Firefox).
Pick a bookmark to add it to the selected topic, as a subtopic or as a note. For more info, see Mindomo Bookmarks.
Evernote
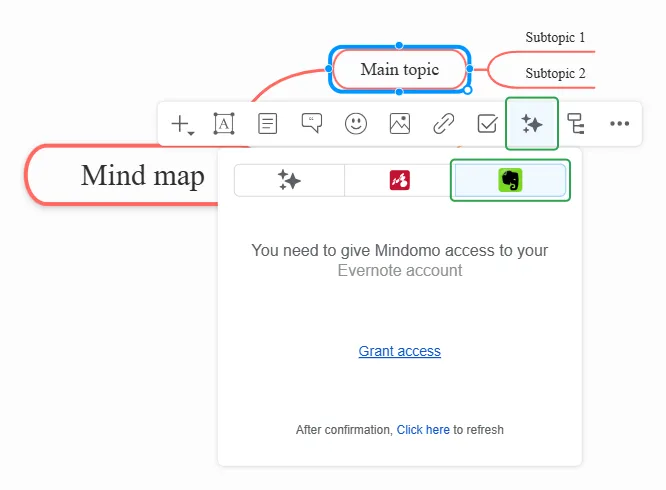
Section titled “Evernote”The Evernote Bookmarks tab lists your Evernote notes, after you grant Mindomo access to your Evernote account. Add a note to the selected topic as a subtopic. For more info, see Evernote.
Layout and Lines
Section titled “Layout and Lines”The layout decides how a topic’s subtopics are arranged: spread around it like a mind map, stacked like an org chart, laid out along a timeline, and so on. The lines decide how those topics are connected. Both apply only to the selected topic’s branch, so you can mix different layouts and line styles in one map.
Select a topic and click Layout on the toolbar. The panel has two tabs, Layout and Line.
The Layout tab arranges the selected topic’s subtopics:
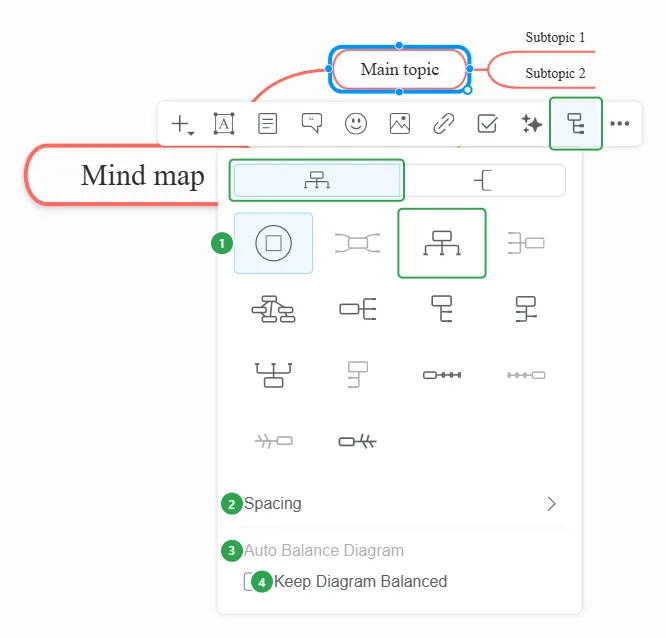
- Layouts - Mind Map, Org chart (Up to Down), Logic chart (Left), Concept Map, Logic Chart (Right), Tree chart, Timeline, Org Chart (Down to Up), Fishbone (Ishikawa diagram) and more.
- Spacing - the space between topics and branches.
- Auto Balance Diagram - rearranges the main topics so the map is balanced around the central topic.
- Keep Diagram Balanced - keeps them balanced as you add topics.
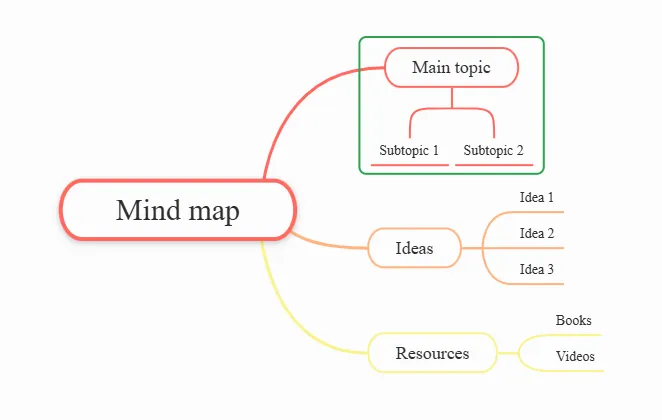
For example, Org chart (Up to Down) on Main topic changes only that branch:
The Line tab styles the lines that connect the selected topic to its subtopics:
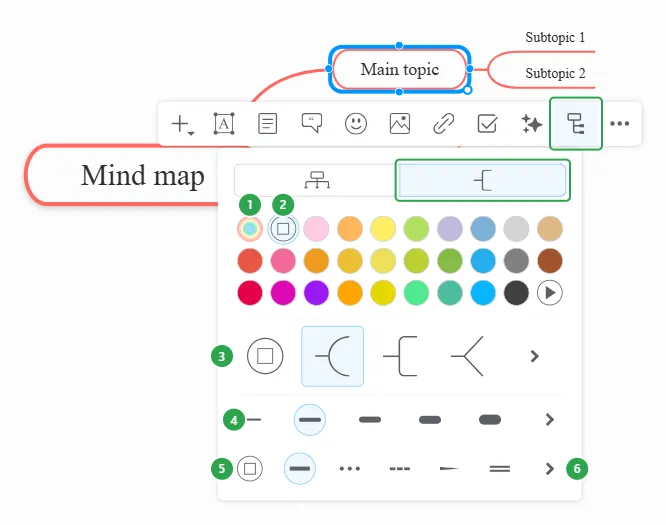
- Multicolor - a different color for each branch.
- Line color.
- Connection type - Curve, Rounded Elbow or Straight.
- Weight.
- Line pattern - Solid, Dotted, Dashed, Tapered or Double Line.
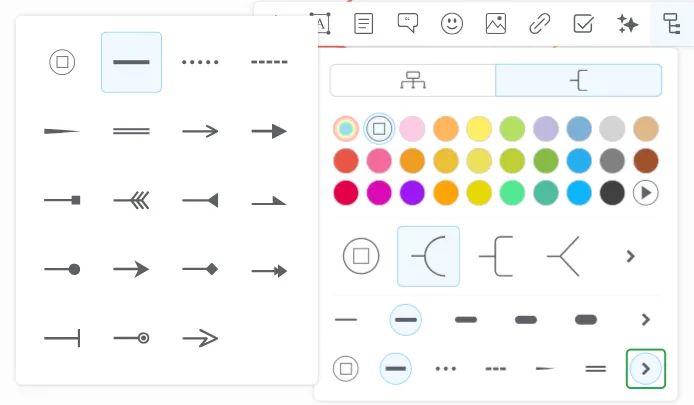
- Line endings - opens the endings below.
For example, Straight on Main topic:
More Actions
Section titled “More Actions”Click More on the toolbar:
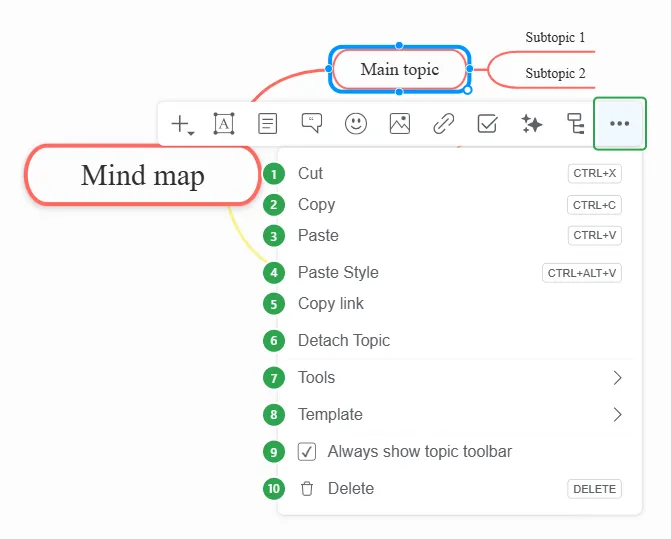
- Cut (CTRL+X) - removes the topic, with all its subtopics, and keeps it on the clipboard so you can paste it somewhere else. Use it to move a branch to another part of the map, or to another map (see Copy-Paste Branches).
- Copy (CTRL+C) - copies the topic, with all its subtopics, to the clipboard. The original stays where it is.
- Paste (CTRL+V) - adds what you cut or copied as a subtopic of the selected topic. For example, copy Main topic, select Resources and paste: a copy of Main topic, with Subtopic 1 and Subtopic 2, appears under Resources.
- Paste Style (CTRL+ALT+V) - gives the selected topic the look of a topic you copied with Copy Style (see Topic Style): font, colors, shape and so on. Only the look changes; the text stays.
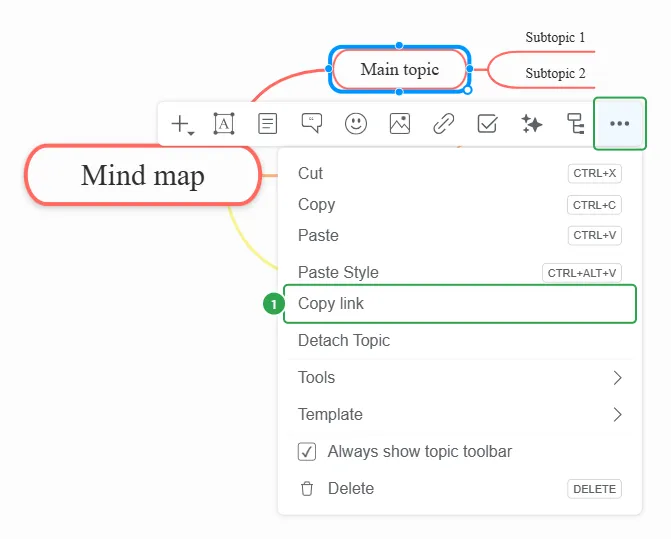
- Copy link - copies a web link that opens the map with this topic highlighted. Paste it in an email or a chat to point someone to an exact spot in the map (see below).
- Detach Topic - cuts the topic loose from its parent and turns it into a floating topic, which you can drag anywhere on the canvas.
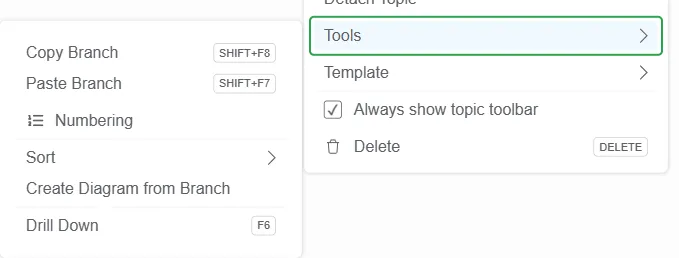
- Tools - commands for working with a whole branch: copy and paste it, number or sort its topics, turn it into a separate diagram, or focus on it alone. See Tools.
- Template - options for maps made from a template, such as editing or removing the template (see below).
- Always show topic toolbar - when it’s on (the default), the toolbar appears every time you select a topic. Turn it off if the toolbar gets in the way; you can still show it when you need it by right-clicking a topic or pressing SHIFT+F10.
- Delete (DELETE) - removes the topic together with all its subtopics. To get them back, use Undo (CTRL+Z).
Copy Link to Topic
Section titled “Copy Link to Topic”Click More, then Copy link (1):
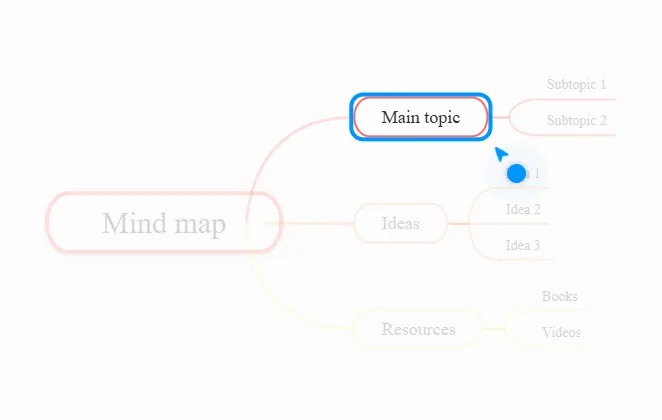
Anyone who opens the copied link sees the map with the topic highlighted, the rest faded, and an arrow pointing to it:
Tools holds:
- Copy Branch (SHIFT+F8)
- Paste Branch (SHIFT+F7)
- Numbering
- Sort
- Create Diagram from Branch
- Drill Down (F6)
See each of these options explained in Tools.
Template
Section titled “Template”Template turns your map into a template that others can fill in. It holds:
- Edit - opens the template panel, where you write guidelines for the topic (the Wiki) and set how people can fill it in (the Options).
- Hide wiki on all topics - hides the guidelines on every topic, so you can see the map as it looks without them.
- Remove - removes the template guidelines and options from the topic.
- Help - opens help on templates.
See each of these options explained in Creating templates.
Focus and Selection
Section titled “Focus and Selection”Select several topics to change them all in one step, and collapse branches to hide the parts of a large map you are not working on.
Select Multiple Topics
Section titled “Select Multiple Topics”To select several topics:
- Hold CTRL and click each topic. Click a selected topic again, still holding CTRL, to remove it from the selection.
- Hold SHIFT and drag a rectangle over the topics.
- Press CTRL+A to select all topics.
The toolbar then shows only the options that work for several topics at once, and whatever you choose applies to every selected topic. One button appears only when several topics are selected: Align lines them up Left, Center or Right.
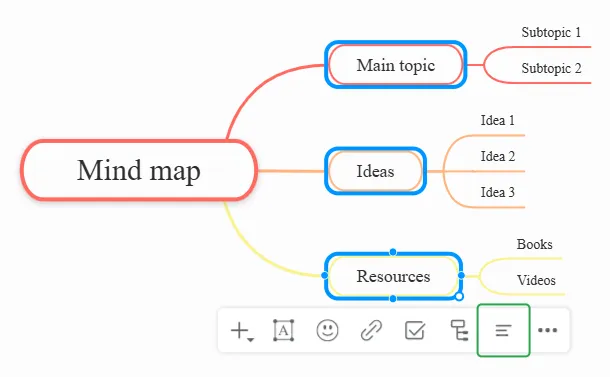
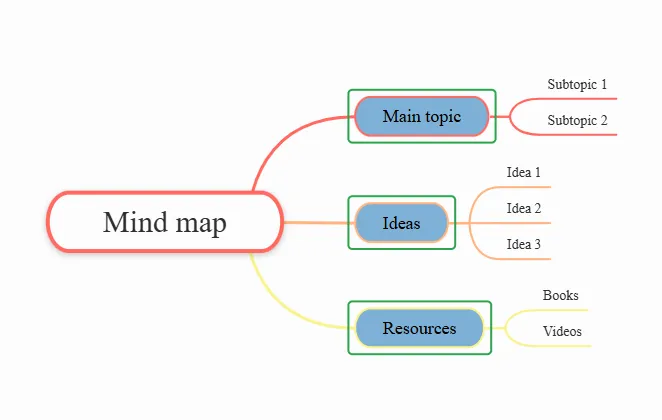
For example, here three topics were selected and given the same background color in one step:
Collapse Branches
Section titled “Collapse Branches”When a map grows large, you can hide the branches you are not working on. The hidden topics are not deleted; they come back when you expand the branch again. Use these shortcuts:
- SPACE - collapses the selected topic and hides all of its subtopics.
- CTRL+1, CTRL+2 or CTRL+3 - shows only the first one, two or three levels of subtopics and collapses everything below them.
- CTRL+4 - shows all levels again.
- CTRL+0 - collapses the whole diagram down to the central topic.
On a Mac, use CMD instead of CTRL, both for selecting and for collapsing. For more shortcuts, see Shortcuts.
Undo and Redo
Section titled “Undo and Redo”Click Undo (1) or Redo (2) in the top bar, or press CTRL+Z / CTRL+Y:

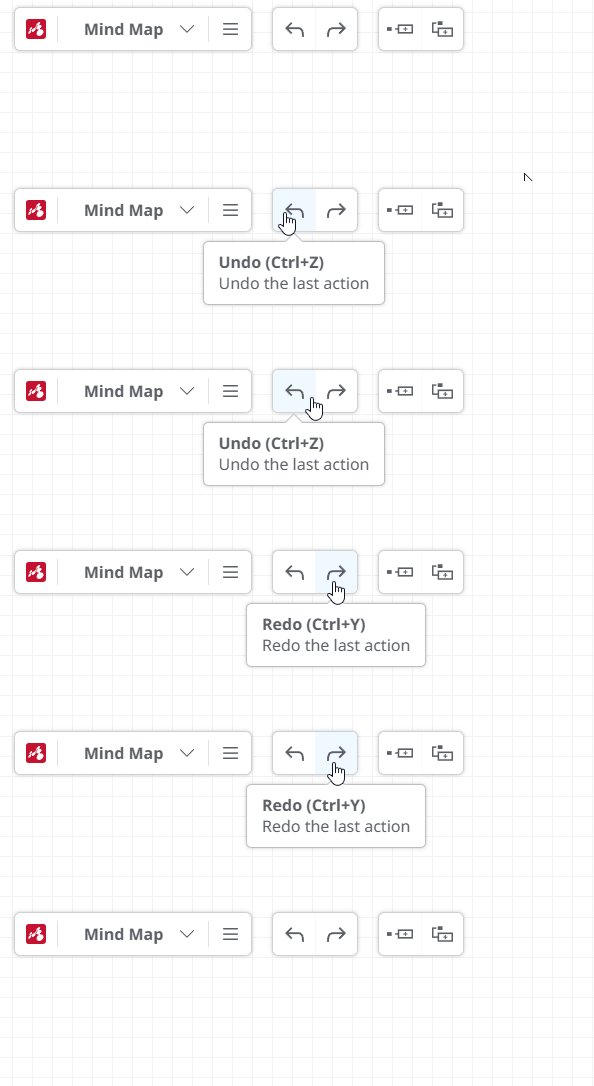
If you click Undo repeatedly, the following warning will appear:

Switch Views
Section titled “Switch Views”You can open the same mind map as an outline or as a Gantt chart. The content stays the same; only the way it is shown changes, so you can switch back at any time.
- Click the More button (1) next to the map’s name, at the top left.
- Choose View as Outline or View as Gantt (2).
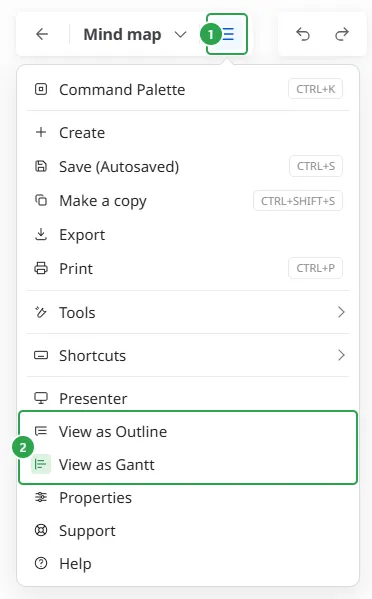
- View as Outline shows the topics as an indented list, with the central topic as the title. See Working with Outlines.
- View as Gantt shows the topics as tasks on a Gantt chart, where you can give them start and end dates. See Gantt Chart.