Working with Concept Maps
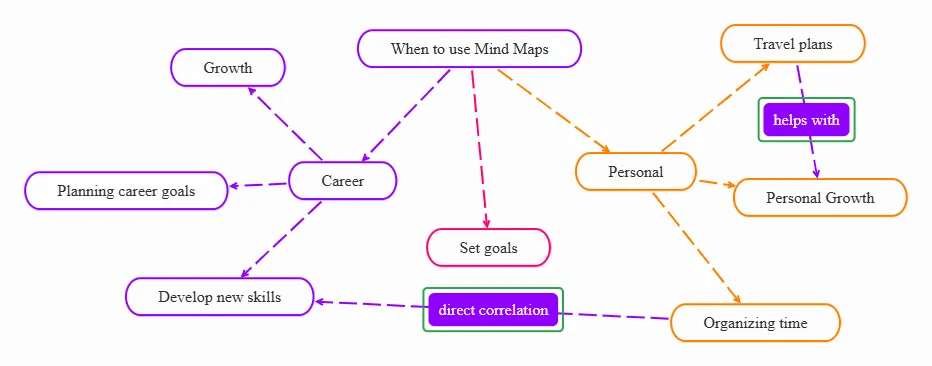
A concept map organizes concepts and shows how they relate to one another through labeled connections. In contrast with the rigid structure of the mind map, the concept map maintains a flexible layout: you can move your topics anywhere on the map canvas by dragging them and organize your map as you see best.
Whenever you add a new topic in your concept map, you can instantly explain how it’s linked to the previous one by labeling their connecting lines. As you add more topics, you may even see new connections between your ideas.
Create a concept map
Section titled “Create a concept map”From the Dashboard
Section titled “From the Dashboard”Click the Create button (1) at the top of the Dashboard’s left panel. The Create new panel opens. Click Concept map (2).
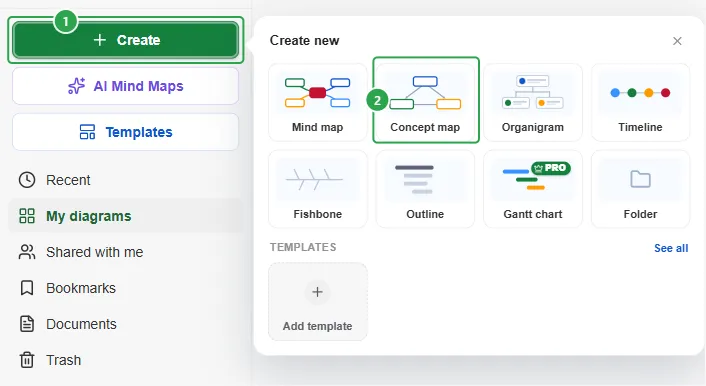
The concept map is created right away and opens in the editor, with a central topic named “Concept map”.
From an existing map
Section titled “From an existing map”You can turn any existing map into a concept map. Open the map, select its central topic, click Layout on the topic toolbar, then All layouts (the last button in the Layout row), and choose Concept Map.
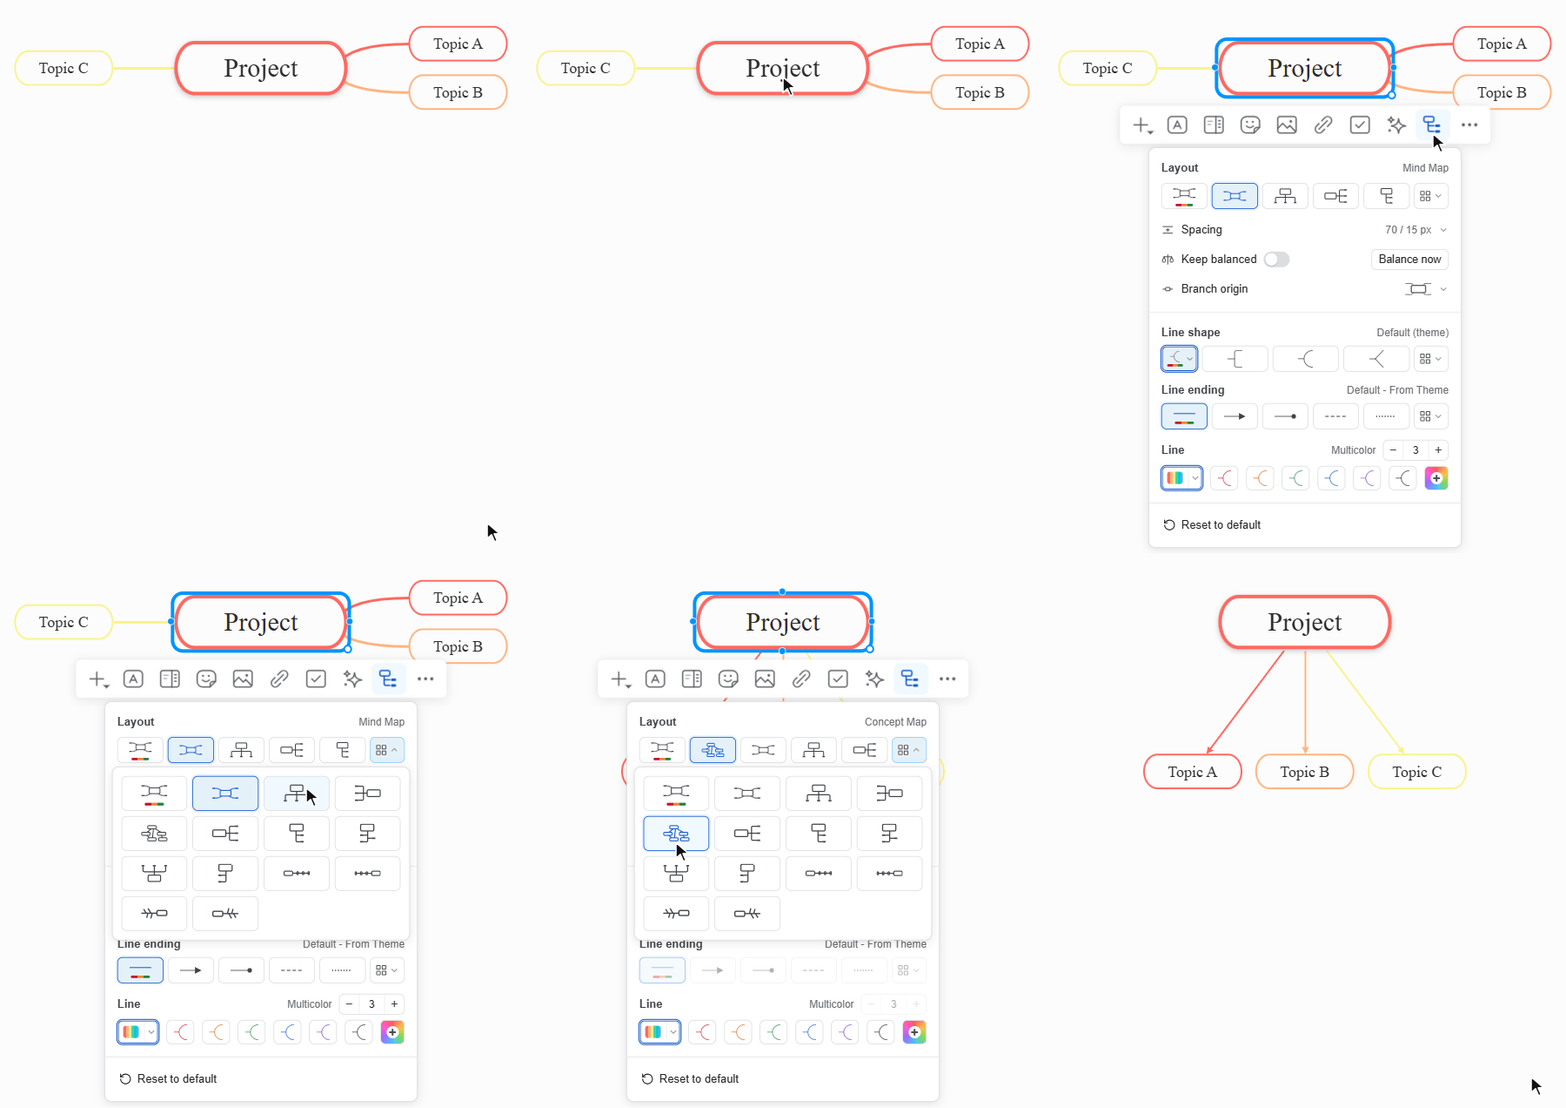
The subtopics are rearranged below the central topic and joined to it by arrows. From then on, you can label the connecting lines and move the topics freely, as described below.
Build your concept map
Section titled “Build your concept map”Add topics
Section titled “Add topics”Add the main concepts related to your central idea, then expand them with more specific topics.
- Press TAB to add a subtopic. In a concept map, a new subtopic appears below its parent, connected to it by an arrow. To add a topic at the same level, press ENTER while you are typing a topic’s text.
- You can also click the Insert (+) button on the topic toolbar and choose Insert subtopic.
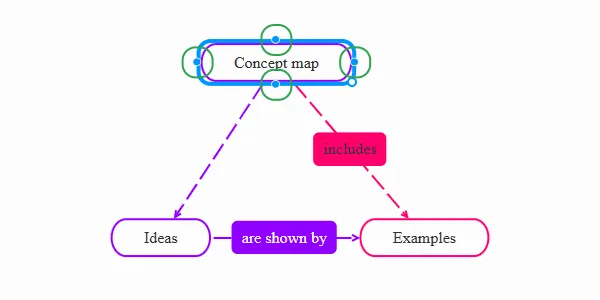
- When you select a topic, four Insert subtopic bullets appear around it. Click a bullet to add a subtopic on that side, or drag it to an empty spot on the canvas to place the new subtopic there.
Connect topics
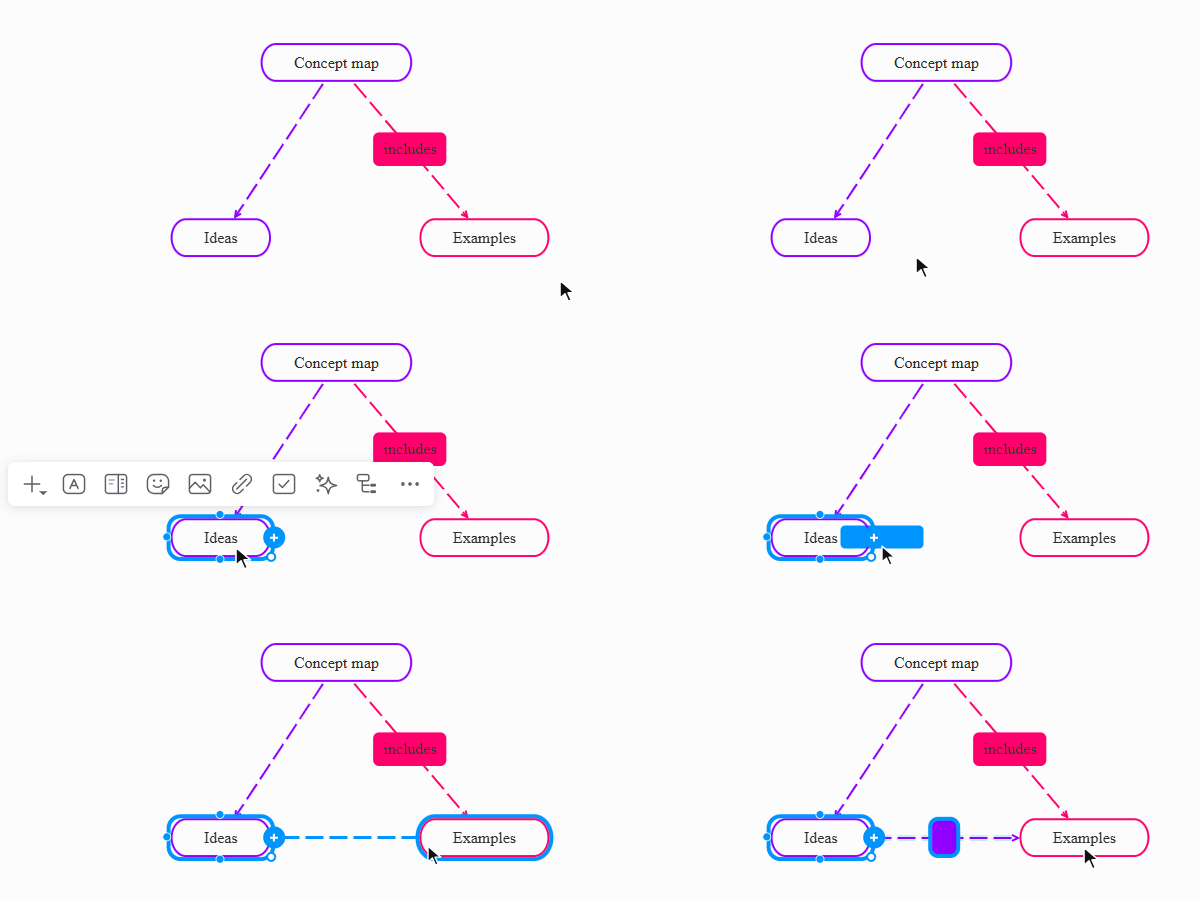
Section titled “Connect topics”Create a relationship to connect two topics that are not already linked:
- Click a topic to display the four bullets
- Drag one of the bullets onto the topic you want to connect
- Drop the bullet to create the relationship
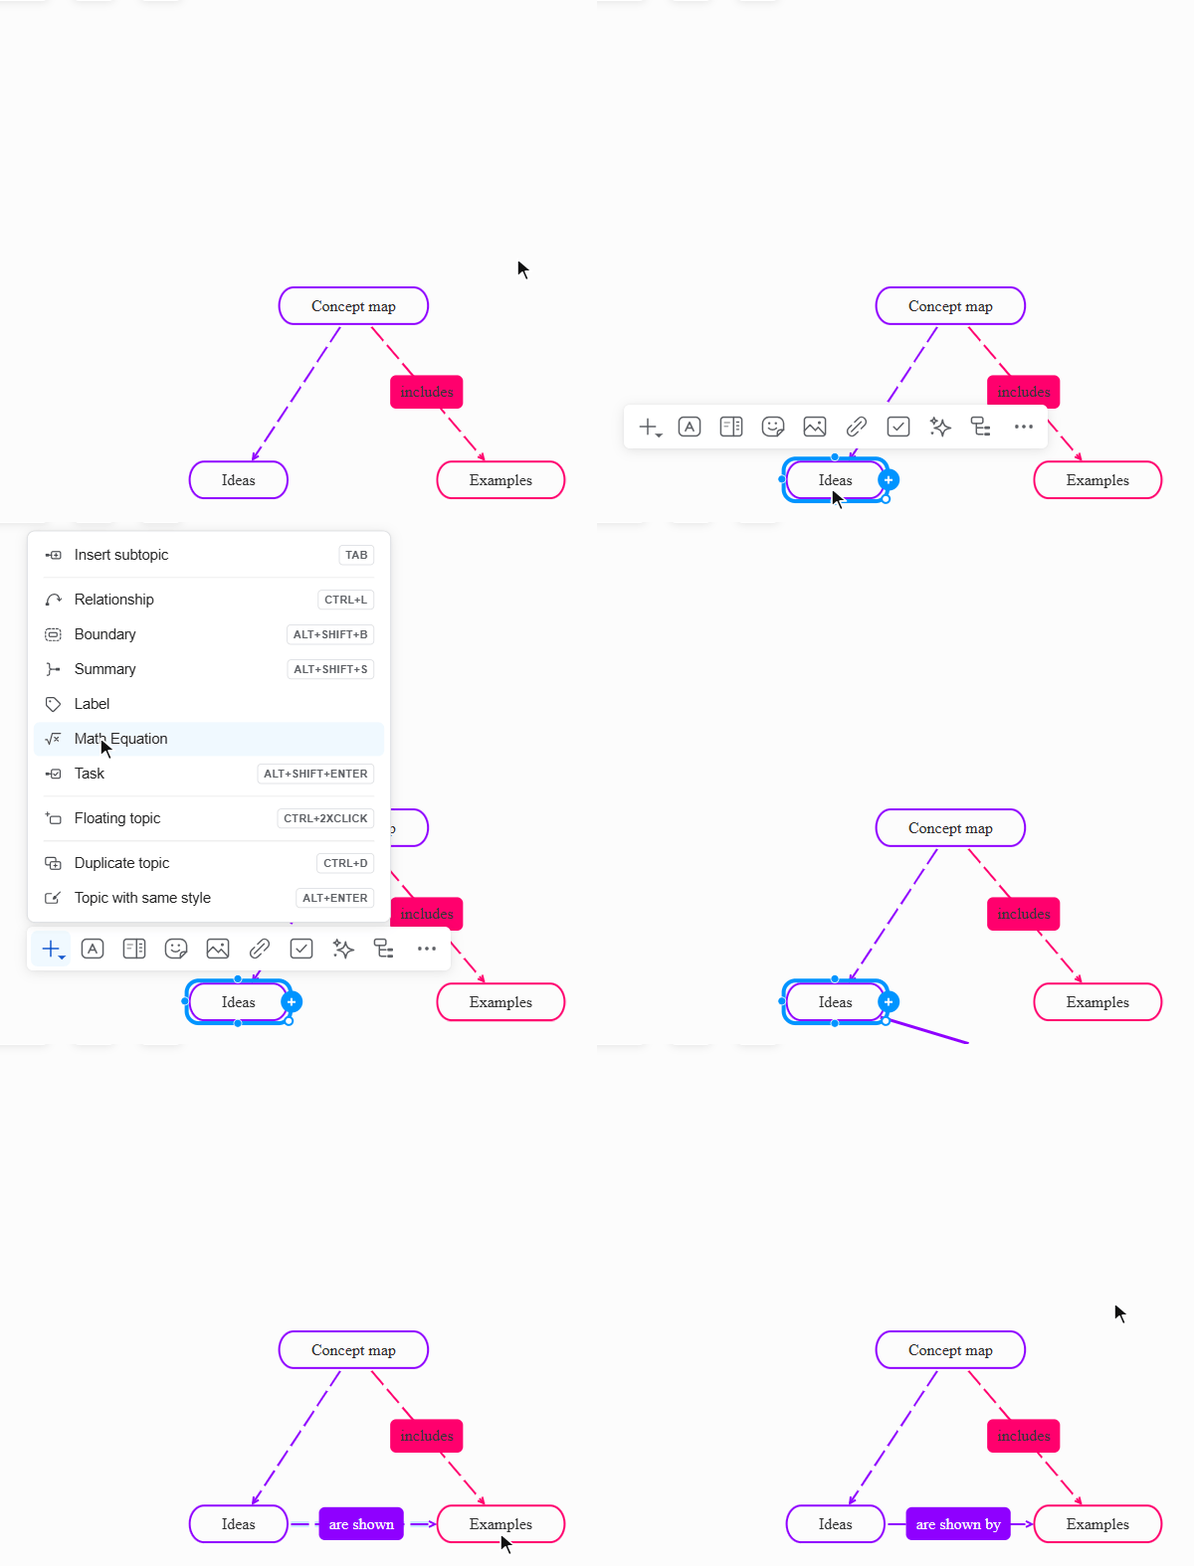
- Alternatively, click the Insert (+) button and select Relationship from the menu, or press CTRL+L
Describe relationships with labels
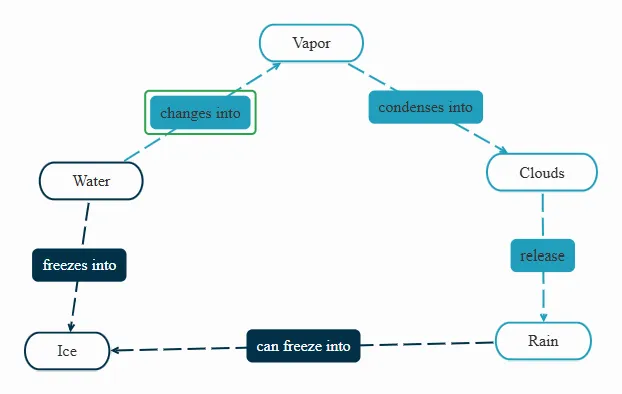
Section titled “Describe relationships with labels”A label says how two topics are related. Any connecting line can have one, whether it joins a topic to its subtopic or is a relationship. Aim for a short phrase that makes the two topics read as a meaningful statement, for example:
- Water changes into vapor
- Exercise improves cardiovascular health
- Deforestation contributes to habitat loss
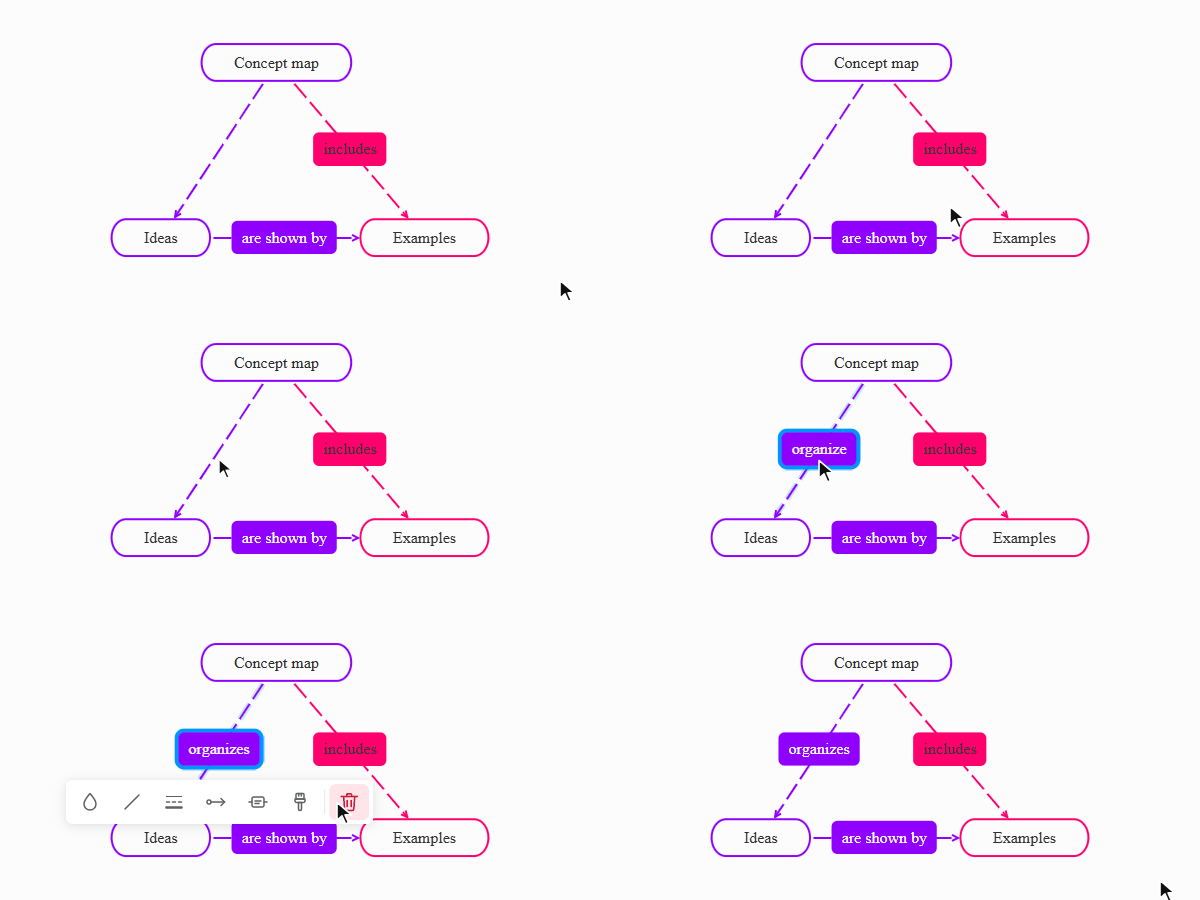
To add a label:
- Click the line. An empty label box appears on it, already selected.
- Type the label.
- Press ENTER.
When you add a relationship from the Insert (+) menu, its label box is already selected once you click the second topic. Type the label and press ENTER.
Move topics freely
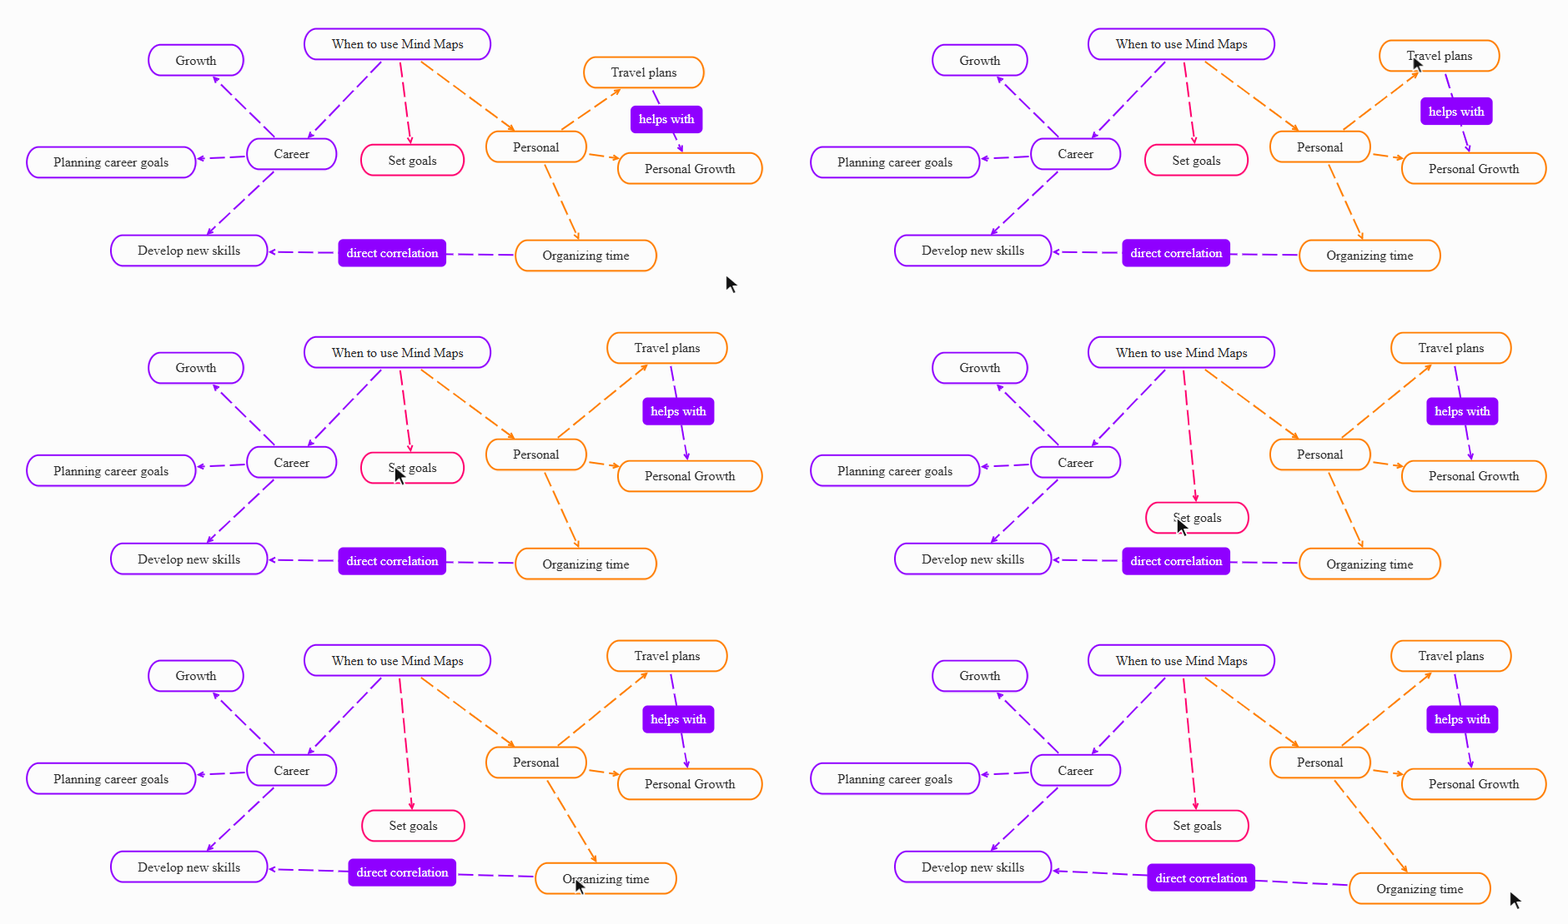
Section titled “Move topics freely”Drag topics anywhere on the canvas to reorganize your concept map. Relationships stay connected as you move the topics, so you can arrange ideas in the way that best represents their connections.
Customize lines and labels
Section titled “Customize lines and labels”Relationships and the lines between a topic and its subtopics are customized from the same toolbar. Click a line or relationship, or its label, to select it. Its toolbar appears:
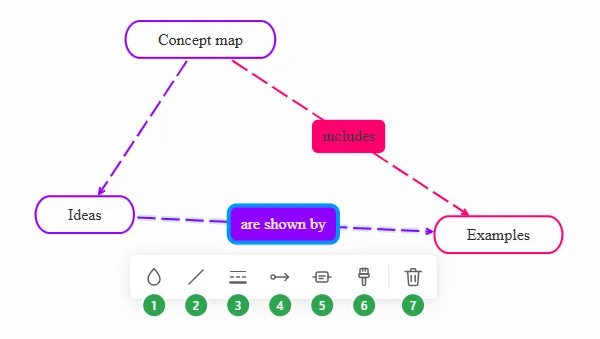
- Color - the color of the line, from the theme’s default to any custom color.
- Shape - Straight Line, Angle, Zigzag, Arc, or Single Angle.
- Width and line type - how thick the line is and its pattern: Solid, Medium Dash, Dash Dot, Big Dash, Big Dash Dot, Dot, or Dash Dot Dot.
- Line endings - the arrowheads at each end (see below).
- Add label - adds a label to the line. Once the line has a label, this button becomes Label and styles it (see below).
- Copy, paste or set default style - Copy style (CTRL+ALT+C) and Paste style (CTRL+ALT+V) copy the look of one line to another. Set as default style uses this look for the lines you draw next, and Reset to theme style goes back to the theme’s look.
- Delete connection - deletes the line. If it’s a line between a topic and its subtopic, the subtopic stays on the map but is no longer connected to its parent.
Line endings
Section titled “Line endings”Line endings sets the two ends of the line separately:
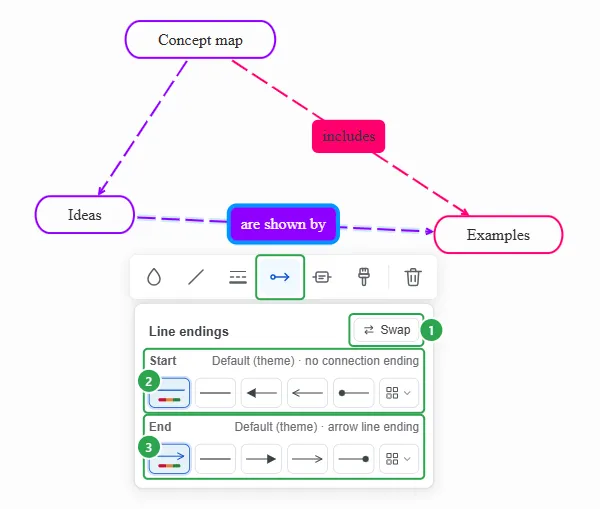
- Swap - exchanges the start and end, so the arrow points the other way.
- Start - the ending at the first topic: none, a filled arrow, a line arrow, or a circle. The last button opens all the endings.
- End - the ending at the second topic, with the same choices.
Label style
Section titled “Label style”Label styles the label of the line:
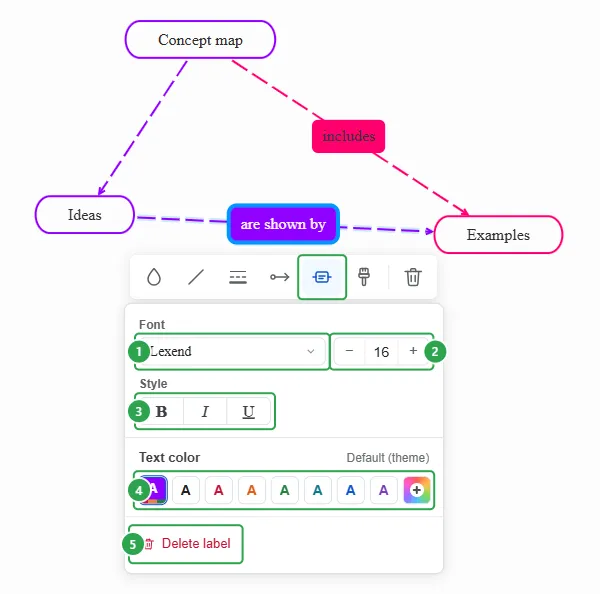
- Font - the font family of the label.
- Text size - type the size or use - and +.
- Style - Bold, Italic, and Underline.
- Text color - the color of the label text. Default (theme) uses the theme’s color; the last swatch opens a color picker for any color.
- Delete label - removes the label. The line stays.
To change the label’s text, click it and type.
Themes
Section titled “Themes”To change the look of the whole concept map at once, click Themes (the color wheel) in the top bar. The Style panel opens; its settings apply to the whole diagram. On a concept map, the Layout list (1) opens at the Concept Map styles:
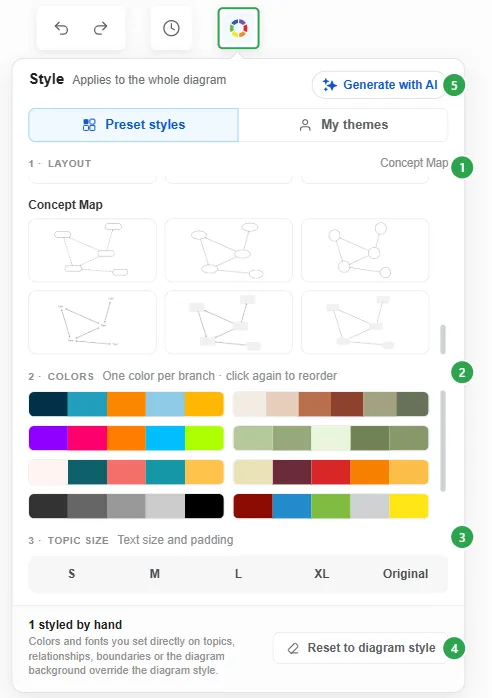
Choose one of the Concept Map styles (1), a color palette (2), and the topic size (3). Reset to diagram style (4) removes the colors and fonts you set by hand on topics, relationships, boundaries, or the diagram background. Generate with AI (5), at the top of the panel, lets Mindomo AI create a style from a description. For more details, see Themes.
Ask AI
Section titled “Ask AI”Ask AI lets you work on the whole map together with Mindomo AI, in a chat. Click Ask AI in the bottom right corner of the editor, or open ☰ and choose Ask AI. The Mindomo AI panel opens on the right:
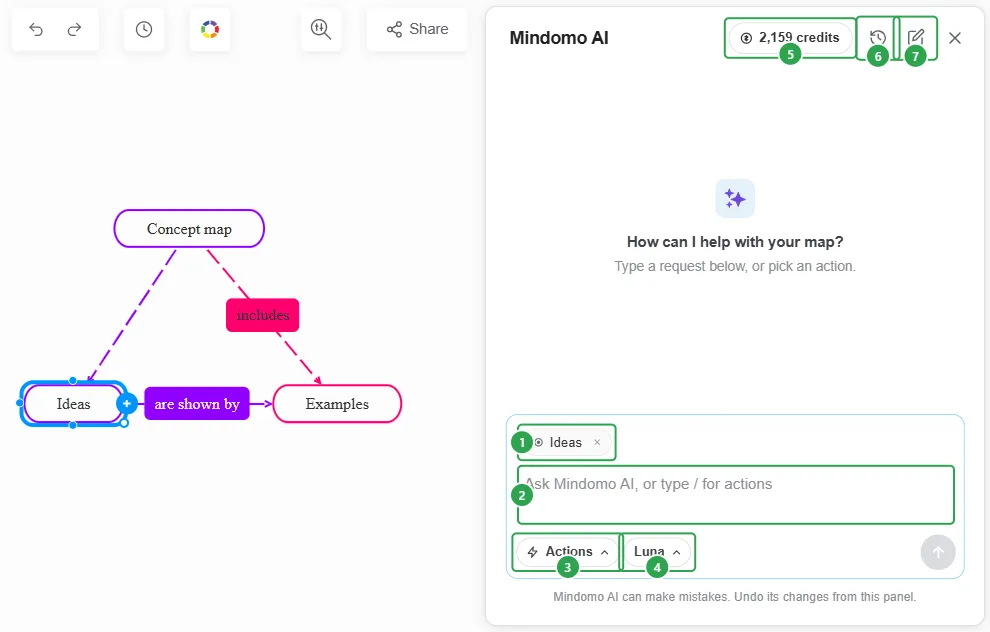
- The selected topic is added to your request, so that Mindomo AI knows what you are referring to. Click × to remove it.
- Type a request or a question about your map, and press ENTER. Type
/to pick an action. - Actions - ready-made actions: Chat about the map, Text to map (turn notes or an article into branches), Expand selection, Summarize, Generate a theme, or Generate a color set.
- The AI model. Each model uses AI credits at a different rate.
- Your remaining AI credits.
- Chat history - your earlier chats.
- New chat - starts a new chat.
Mindomo AI can make mistakes, so check its changes; you can undo them from the panel. For more details, see Mindomo AI.
Switch to another layout
Section titled “Switch to another layout”- Select the central topic.
- Click Layout (1) on the topic toolbar. The Layout panel opens. The Concept Map layout (2) is selected.
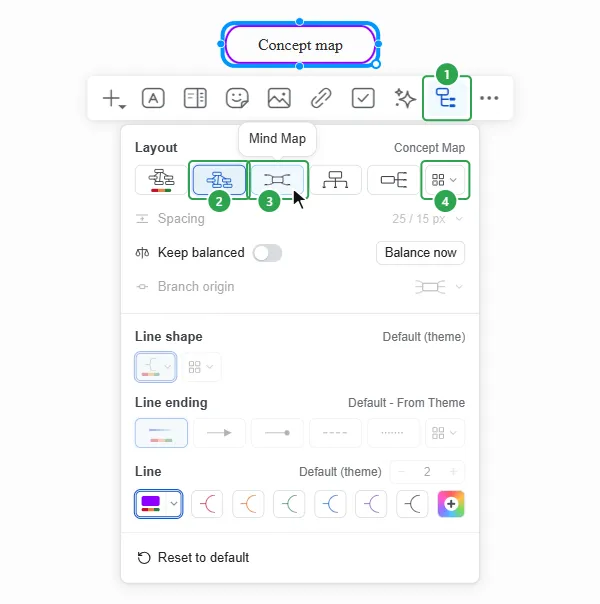
- Choose another layout, for example Mind Map (3), or click All layouts (4) to see every layout, such as Org Chart, Logic Chart, Tree Chart, Timeline, or Fishbone. Hover over a layout to see its name.
- The topics are rearranged automatically to fit the new layout. The labels stay on the connecting lines.
In the Concept Map layout, Spacing, Branch origin, Line shape, Line ending, and the line thickness are grayed out in this panel. To change a single line, select it and use its toolbar (see Customize lines and labels). Balance now redistributes the topics evenly, so the positions you set by dragging them are lost.
View as an outline or as a Gantt chart
Section titled “View as an outline or as a Gantt chart”Instead of changing the layout, you can open the same concept map in another view. The map itself doesn’t change, so you can come back to it at any time.
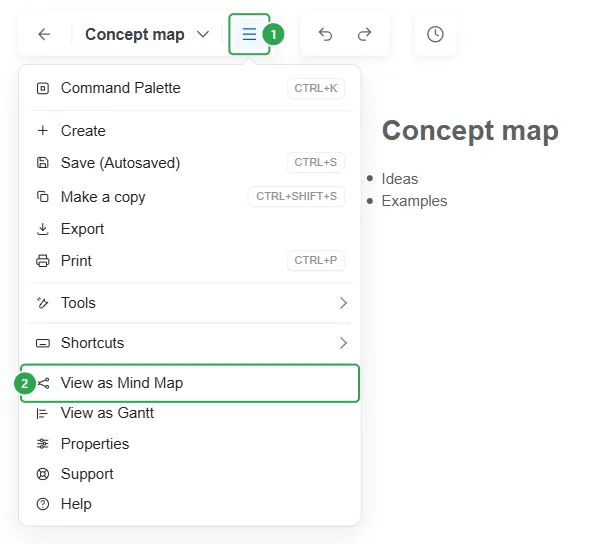
- Click the More button (1) next to the map’s name, at the top left.
- Choose View as Outline or View as Gantt (2).
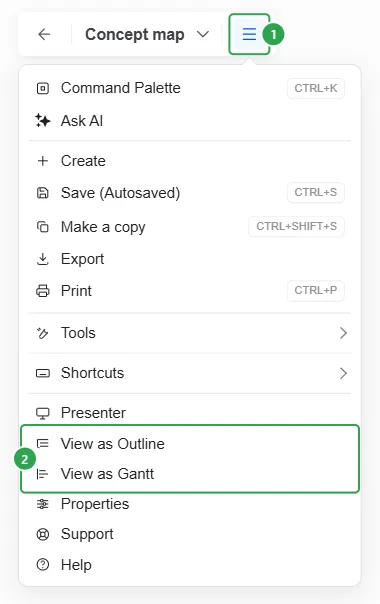
- View as Outline shows the topics as an indented list under the central topic. Labels and relationships aren’t shown in this view. See Working with Outlines.
- View as Gantt shows the topics as tasks on a Gantt chart, where you can give them start and end dates. See Gantt Chart.
To return to the concept map, click the same More button (1). In the outline and Gantt views, the option that brings you back to the map is called View as Mind Map (2), for concept maps too. Choose it, and your concept map opens as you left it, with its labels and topic positions.