

Export Mind Maps
Export your mind maps to documents, images, presentations, spreadsheets, and other mind mapping formats. Most formats have options you can customize. You can also export Gantt charts and outlines.
The formats you can export depend on your plan:
| Plan | Export formats |
|---|---|
| Free | 3: Mindomo (.mom), Mindomo Pack (.pmom), Text (.txt) |
| Student | 5: PDF, PNG, .mom, .pmom, .txt |
| Teacher | 9: PowerPoint, Word, PDF, PNG, OPML, HTML, .mom, .pmom, .txt |
| Premium | 10: PDF, Word, Text, OPML, HTML, PNG, .mom, .pmom, Freemind, MindManager |
| Professional, Team, Business, School | 21: all export formats |
For prices and the full comparison, see the plans for individuals, teams and businesses, and education.
Open the Export dialog
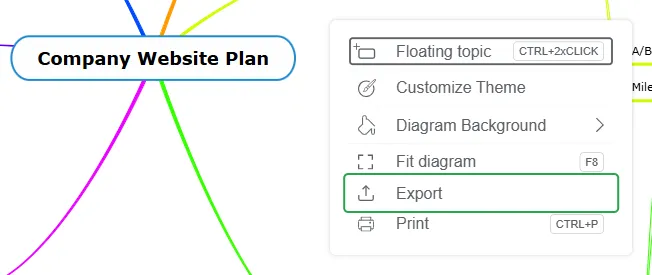
Section titled “Open the Export dialog”With the diagram open in the editor, right-click an empty part of the canvas and select Export.
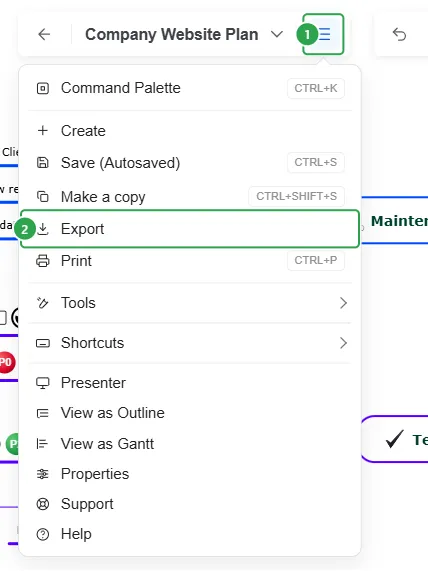
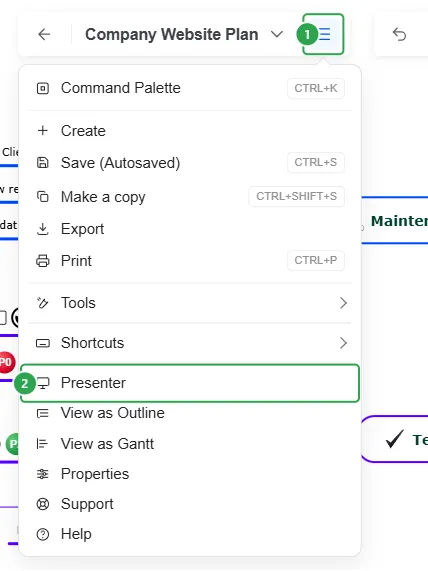
You can also click the menu button next to the diagram title (1) and select Export (2).
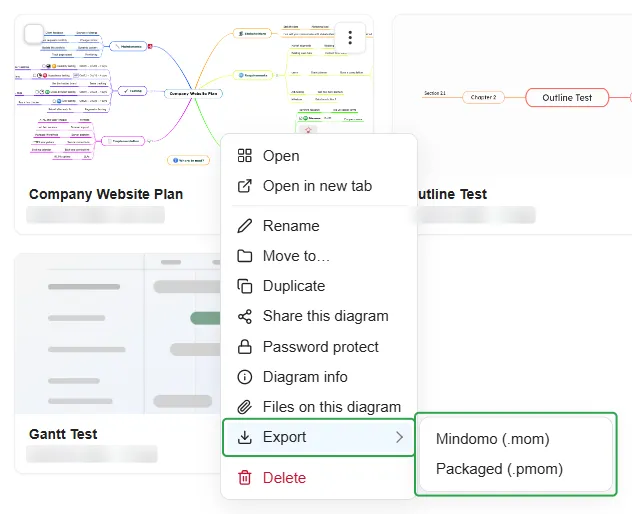
The Export dialog
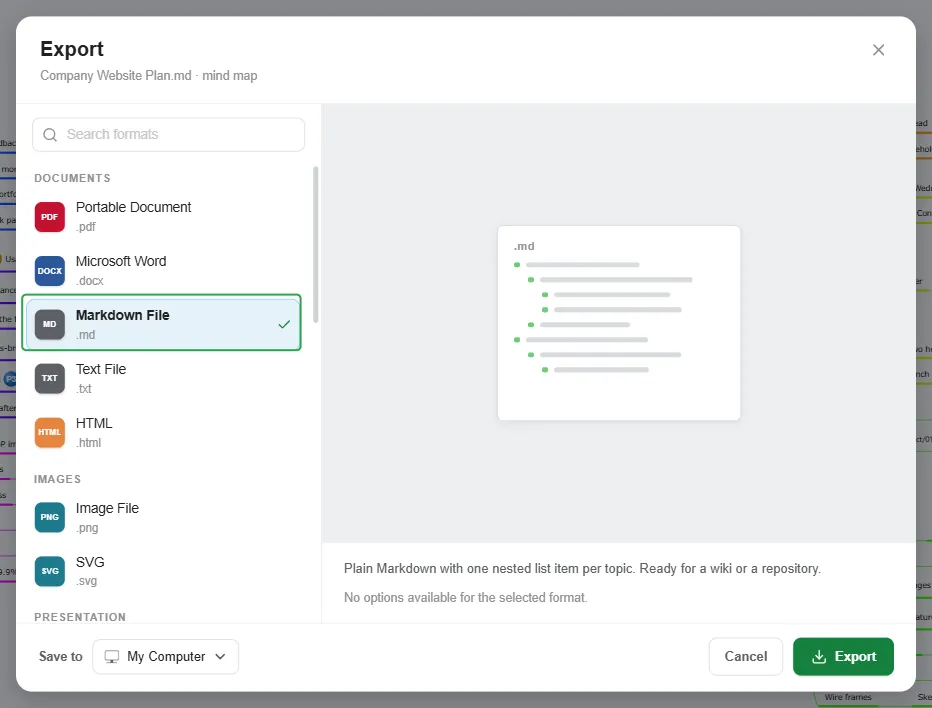
Section titled “The Export dialog”The top of the dialog shows the name of the file you are about to create and the type of diagram, for example “Company Website Plan.pdf · mind map”.
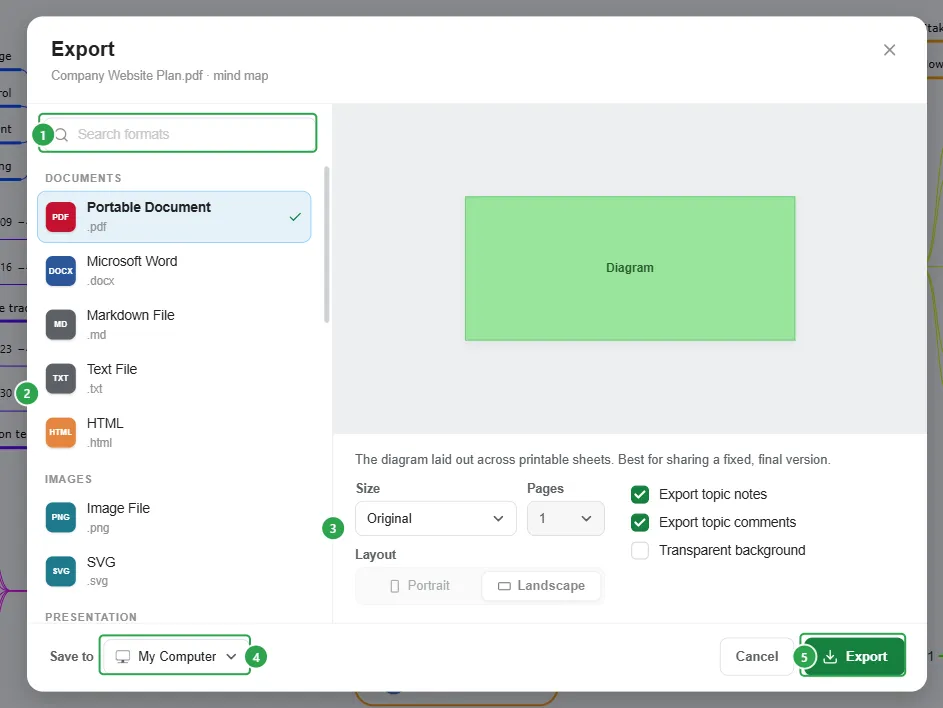
- Search formats: type part of a format’s name to find it quickly.
- The list of formats, grouped into Documents, Images, Presentation, Diagram, and Spreadsheets & project. Each one shows its file extension.
- A preview, a one-line description of the selected format, and its options. Formats without options say “No options available for the selected format.”
- Save to: where the file goes. My Computer downloads it. Google Drive, OneDrive, and Dropbox are also listed.
- Export: creates the file. With My Computer, the download starts at once and the dialog closes.
Documents
Section titled “Documents”Portable Document (.pdf)
Section titled “Portable Document (.pdf)”The diagram laid out across printable sheets. Best for sharing a fixed, final version. You can choose:
- Size (1): A4, A3, A2, Letter, Ledger, Long Bond, Widescreen, or Original, the default. Original puts the whole diagram on a single page that is exactly as big as the diagram, with no empty margins.
- Pages (2): how many sheets the diagram is split across. The choices depend on the size and on how large your diagram is: a smaller sheet offers more pages.
- Layout: Portrait or Landscape. Pages and Layout are not available when Size is Original.
- Export topic notes and Export topic comments, both on by default. Notes and comments are added on their own pages after the diagram, under the title of their topic. Comments show their author and date.
- Transparent background, off by default: leaves out the background color of the diagram, so only the topics and lines appear on the page.
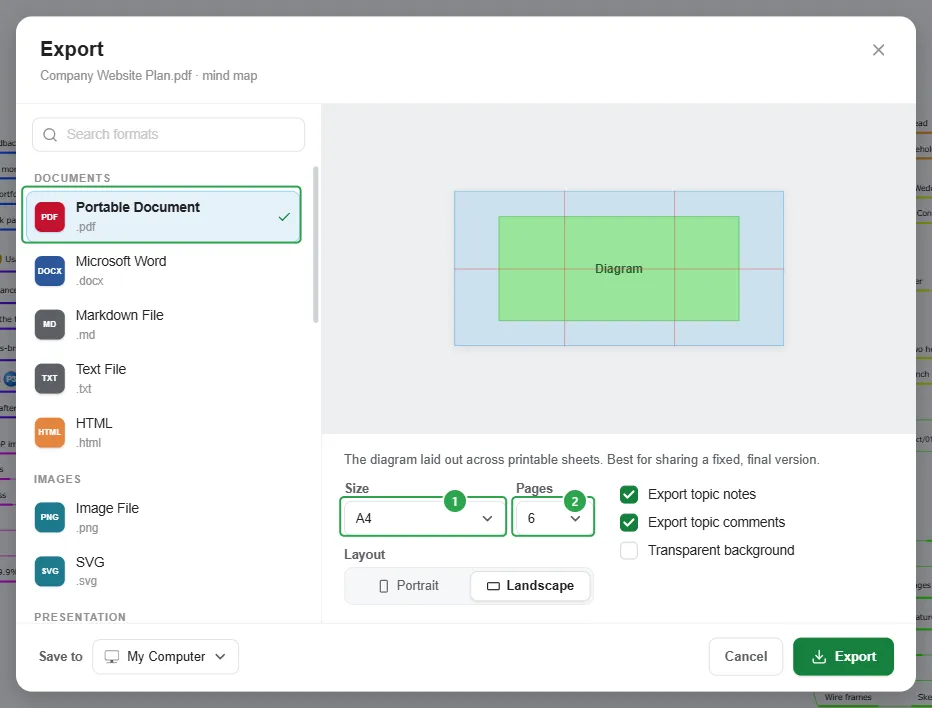
The preview changes with every size, page count, and layout you pick, so you can check the result before exporting. It shows the sheet in blue and your diagram in green, and red lines mark where the diagram is cut between pages. With Original, the preview shows only the diagram, because the page is exactly its size.
Task dates, durations, and priorities appear next to their topics, as they do on the canvas. Hyperlinks in your mind map remain clickable in the PDF: click the link icon next to a topic to open its web page.
To print a diagram instead, see Printing Mind Maps.
Microsoft Word (.docx)
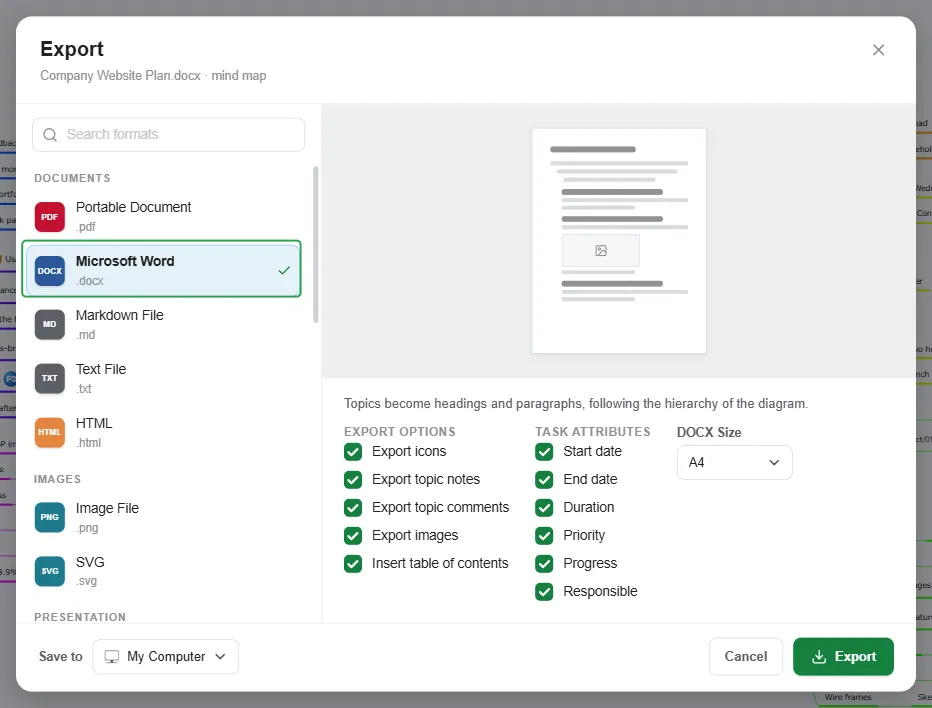
Section titled “Microsoft Word (.docx)”Topics become headings and paragraphs, following the hierarchy of the diagram. You can choose:
- DOCX Size: A4 (default), A3, A5, LETTER, LEGAL, or B4JIS.
- Export options, all on by default:
- Export icons
- Export topic notes
- Export topic comments
- Export images. To export the images inside notes or comments, keep this on together with Export topic notes or Export topic comments.
- Insert table of contents
- Task attributes: Start date, End date, Duration, Priority, Progress, and Responsible. All are on by default.
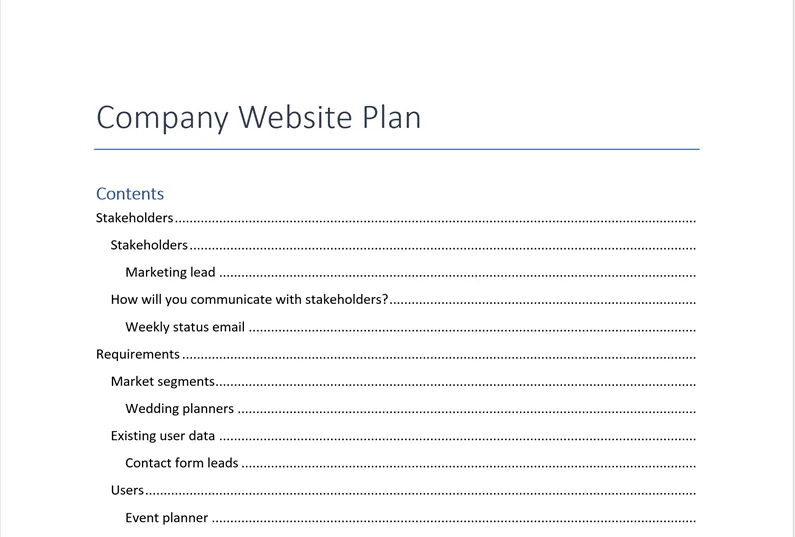
The central topic becomes the document title, followed by a hyperlinked table of contents.
Each topic becomes:
-
A heading with the topic’s title. If the topic has a hyperlink, [link] is added after the title.
-
Its task information on the line below, for example:
Start Date: 10/12, End Date: 10/16, Responsible: …, Duration: 4 day(s), Priority: 0, Progress: 40%
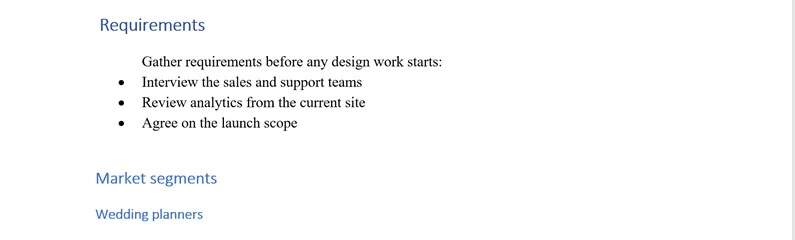
Notes keep their original styling (bullets, numbering, font formatting), and embedded images appear below them. A note in the mind map:
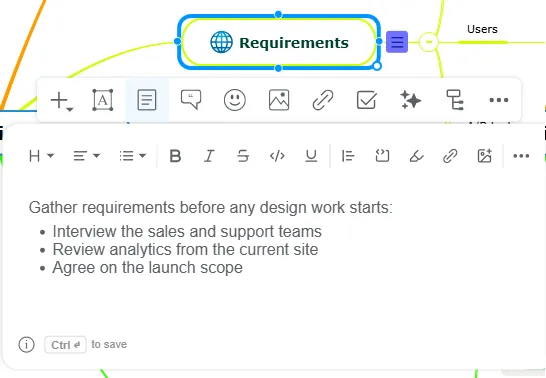
The same note in the Word document, under the heading of its topic:
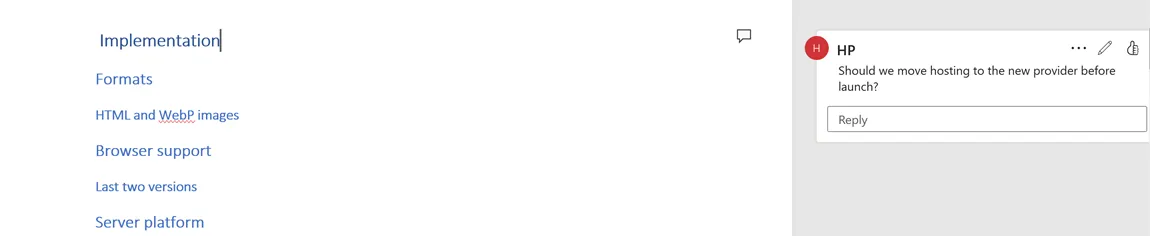
Comments become Word comments in the right margin. A comment in the mind map:
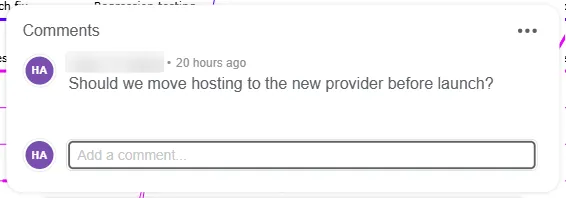
The same comment in the Word document, next to the heading of its topic:
Markdown File (.md)
Section titled “Markdown File (.md)”Your diagram as Markdown, a plain-text format with simple formatting marks. Many wikis and note-taking apps understand it, so when you paste or import the file there, the titles and lists keep their formatting. This format has no options.
How each part of the mind map is written:
| In the mind map | In the Markdown file |
|---|---|
| Central topic and floating topics | Top-level titles: # Topic |
| Main topics | Second-level titles: ## Topic |
| Subtopics | List items: - Topic, indented with one tab per level |
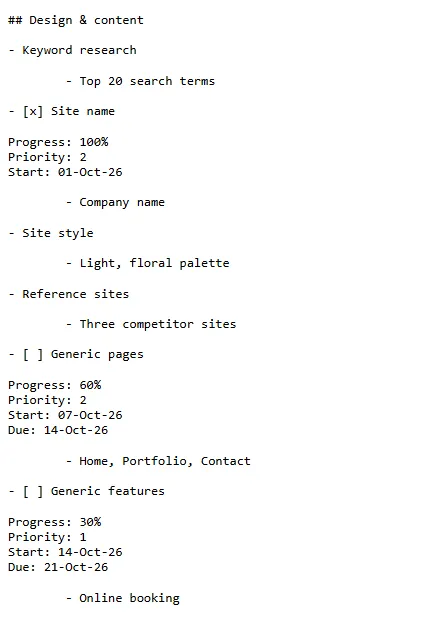
| Task completion (subtopics only) | [ ] incomplete, [x] completed |
| Task information | One line each for Progress, Priority, Start, and Due, below the topic. A parent topic gets only its overall Progress. |
| Notes | Plain text under the topic, after any task information |
| Hyperlink on specific words | [word](link) |
| Hyperlink typed as text | <link> |
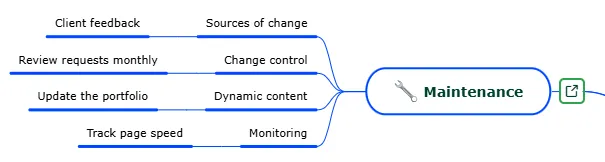
| Hyperlink from the Hyperlink panel | Hyperlink: <link> |
Example: a hyperlink. In the mind map, the hyperlink was added from the Hyperlink panel:
The same branch in the Markdown file:
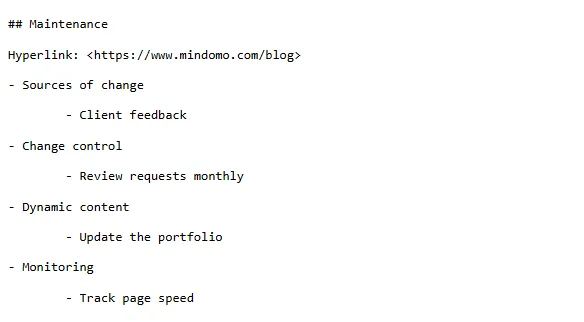
Example: tasks. In the mind map:
The same branch in the Markdown file:
Text File (.txt)
Section titled “Text File (.txt)”Indented plain text with no formatting, the smallest possible copy of the outline. It opens in any text editor, including the ones built into your computer (Notepad on Windows, TextEdit on Mac), and pastes cleanly into an email, a chat message, or another document. This format has no options.
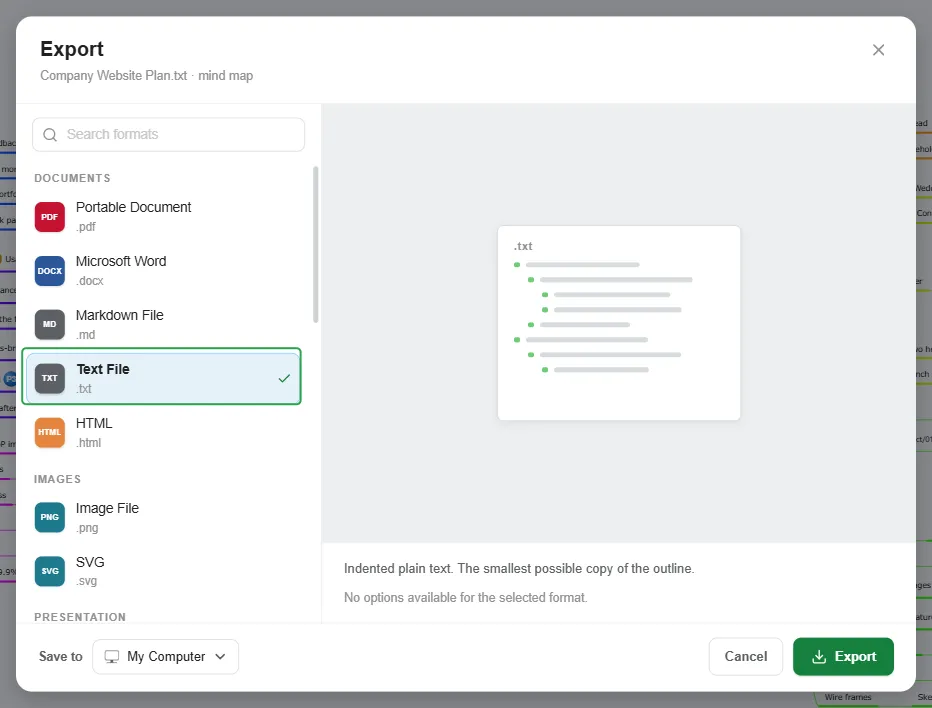
Topics and subtopics are displayed using indentation. Notes, comments, and hyperlinks appear below the relevant topic; each comment starts with its author’s initials. In the example below, Implementation has a comment (1), Testing a note (2), and Maintenance a hyperlink (3).
HTML (.html)
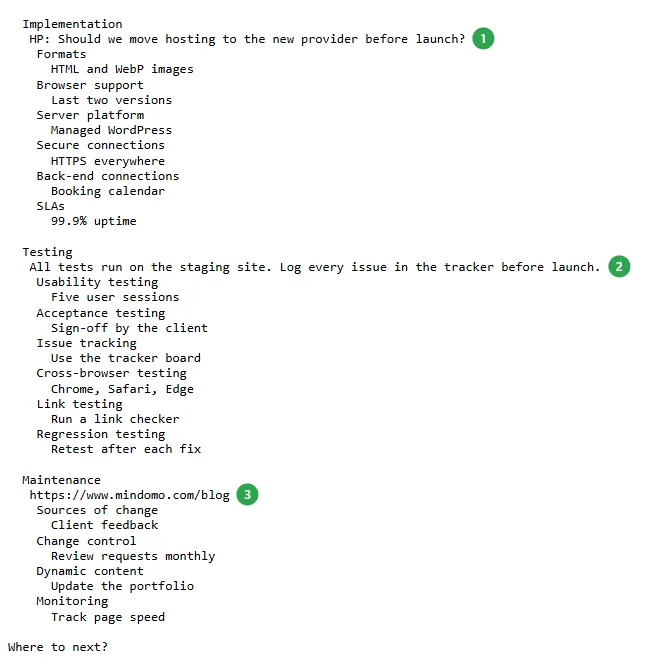
Section titled “HTML (.html)”A single self-contained web page: the interactive diagram, with its own HTML, CSS, and scripts bundled into one file. This format has no options.
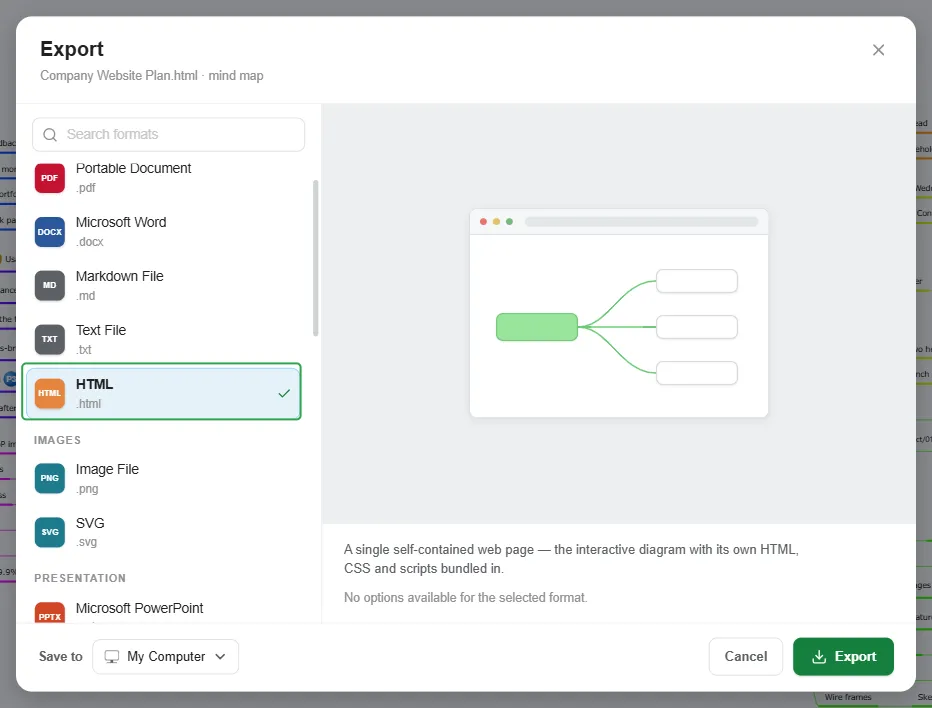
The exported file opens in your default browser, where you can pan and zoom the diagram. It looks as it does in Mindomo, with its colors, icons, images, and task information, and the link icon next to a topic opens its web page in a new tab. Because everything needed to display it is inside the file, even a small diagram makes a file of several MB.
Images
Section titled “Images”Image File (.png)
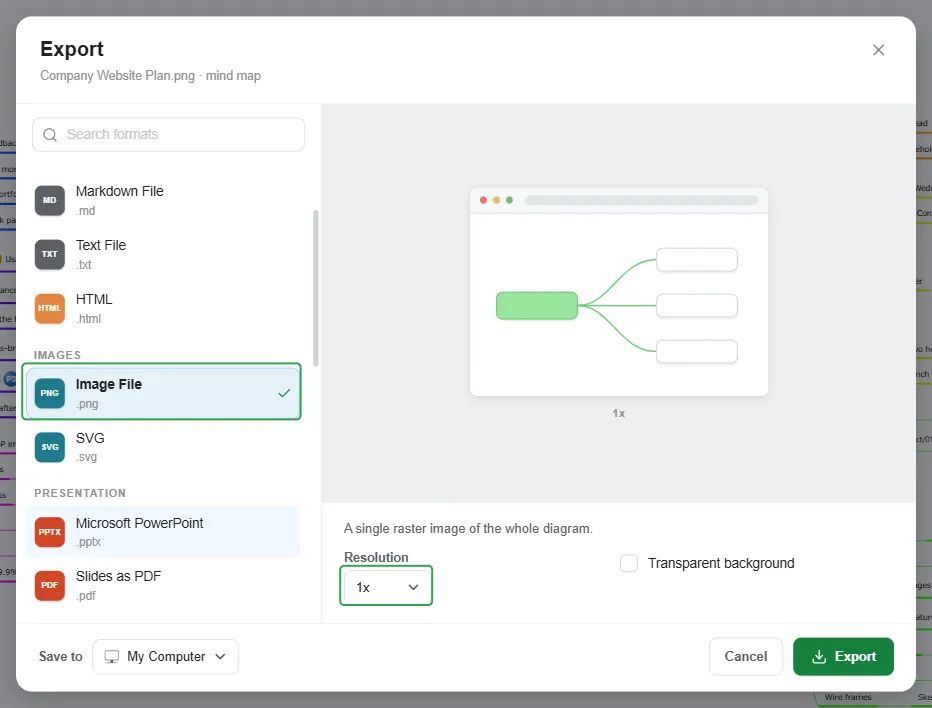
Section titled “Image File (.png)”A picture of your whole diagram in one image file, like a screenshot or a photo. PNG works almost everywhere, from documents and slides to emails. You can choose:
- Resolution: 1x (the default), 2x, 3x, or 4x. A higher resolution gives a larger, sharper image, which is better for printing or for zooming in, but also a heavier file.
- Transparent background: leaves out the background color, so the diagram sits directly on the page or slide you place it on.
If you need to enlarge the diagram a lot, for example for a poster, choose SVG or Portable Document instead: their text stays sharp at any size.
SVG (.svg)
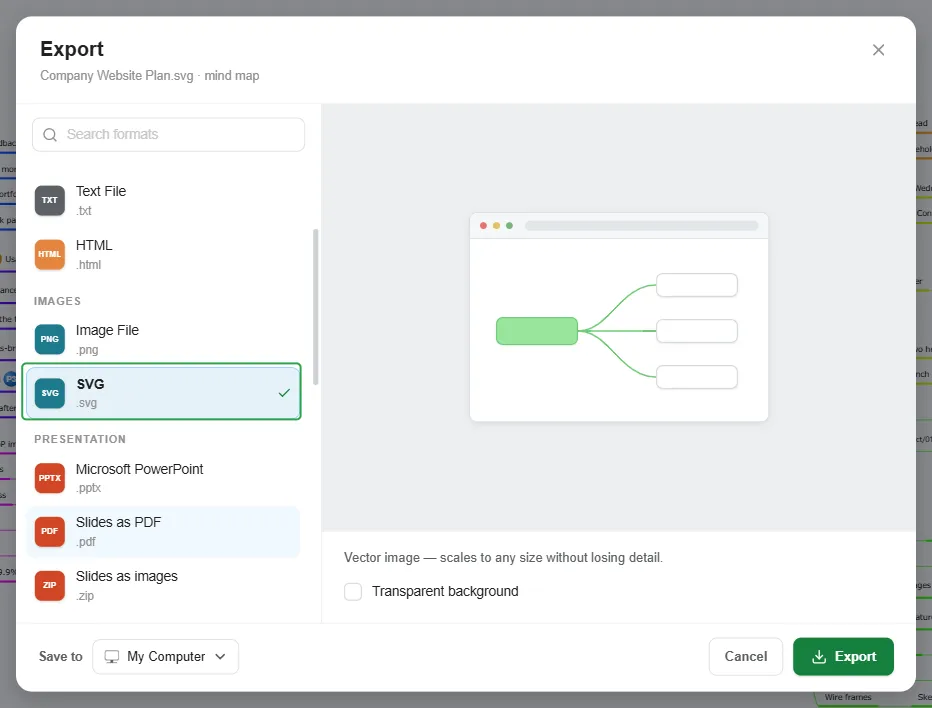
Section titled “SVG (.svg)”A vector image of the whole diagram. Unlike a PNG, which is made of pixels, an SVG stores the topics, lines, and text as shapes, so it stays sharp however much you zoom in or enlarge it. This makes it a good choice for a poster, a large print, a slide, or a web page. The only option is Transparent background.
- Opening it: any web browser opens an SVG file. You can also edit it in vector graphics apps such as Inkscape, Adobe Illustrator, or Figma, for example to change colors or move topics.
- Text: the topic text stays real text, so you can select it, copy it, and search it.
- Images and icons: they are embedded in the file as small pictures, so they do not stay as sharp as the rest when you enlarge the diagram.
Presentations
Section titled “Presentations”These formats turn a presentation into slides. Build the presentation first: click the menu button next to the diagram title (1) and select Presenter (2). See Presenting Mind Maps.
Microsoft PowerPoint (.pptx)
Section titled “Microsoft PowerPoint (.pptx)”Choose what to export from the Export list, and whether to use a Transparent background.
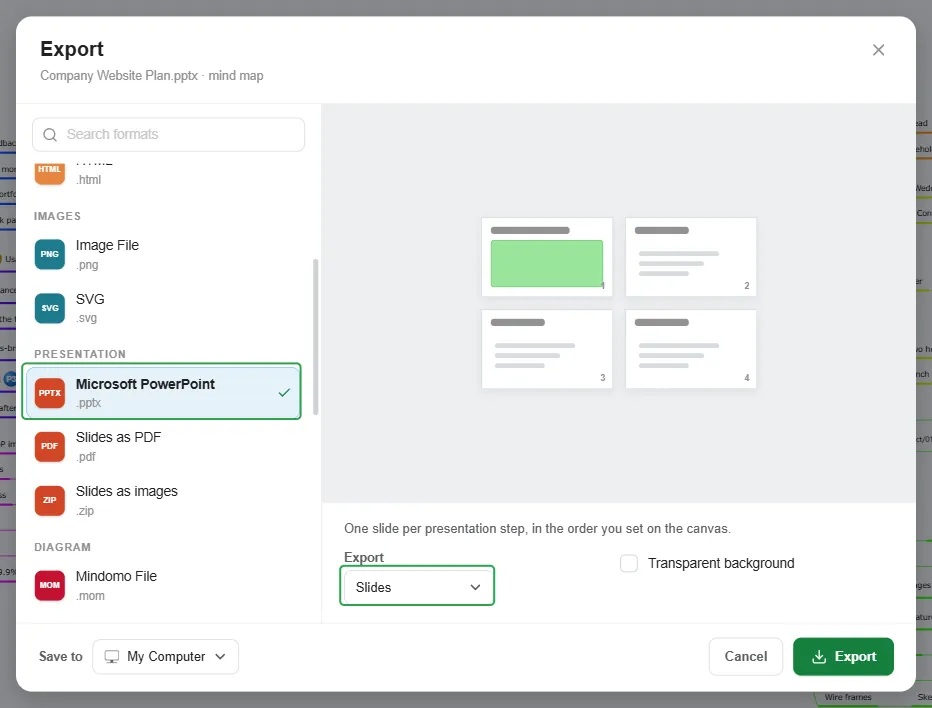
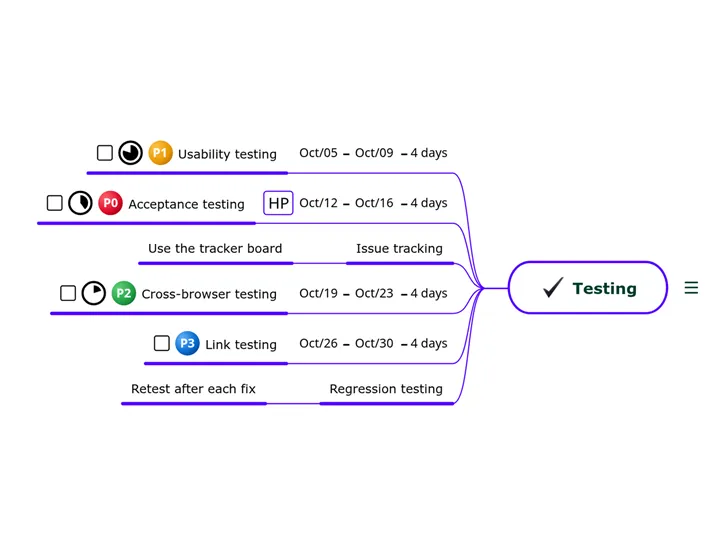
- Slides (the default): one slide per presentation step, in the order you set on the canvas. Each slide is a picture of that step, with the topic text added below as speaker notes. Here is the Testing step as a slide:
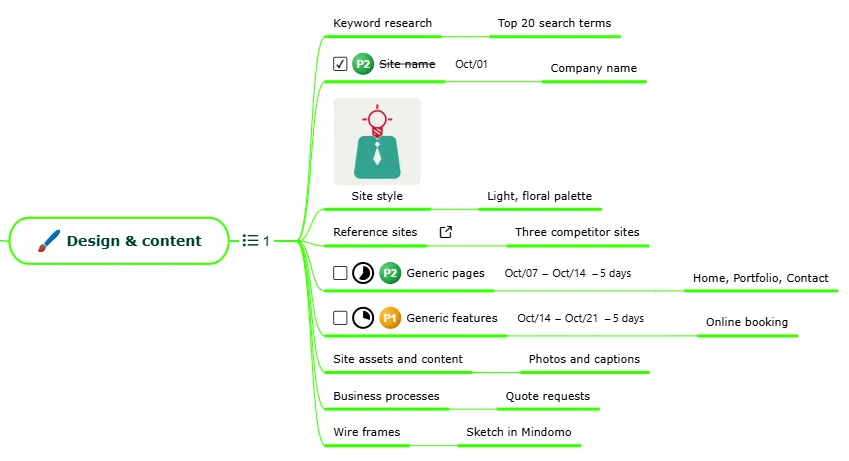
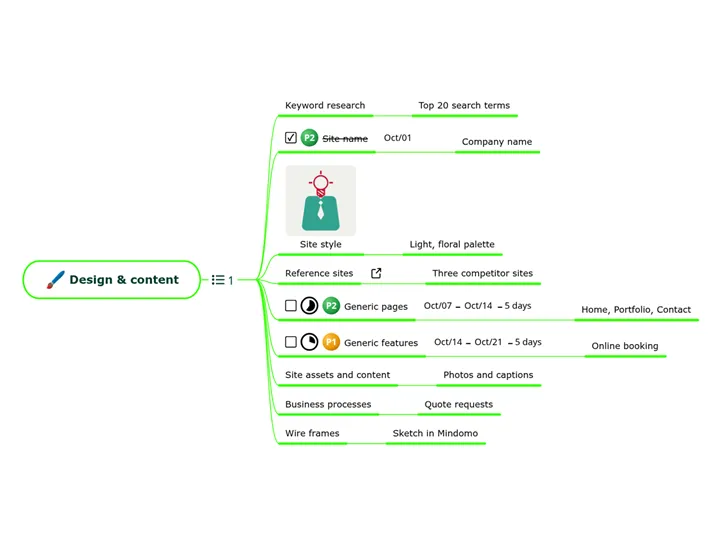
- Main Topics: for diagrams without a presentation. Each slide contains one main topic and its subtopics, with the outline of that branch, including its notes, in the speaker notes. Here is the Design & content branch as a slide:
Slides (.pdf, .zip)
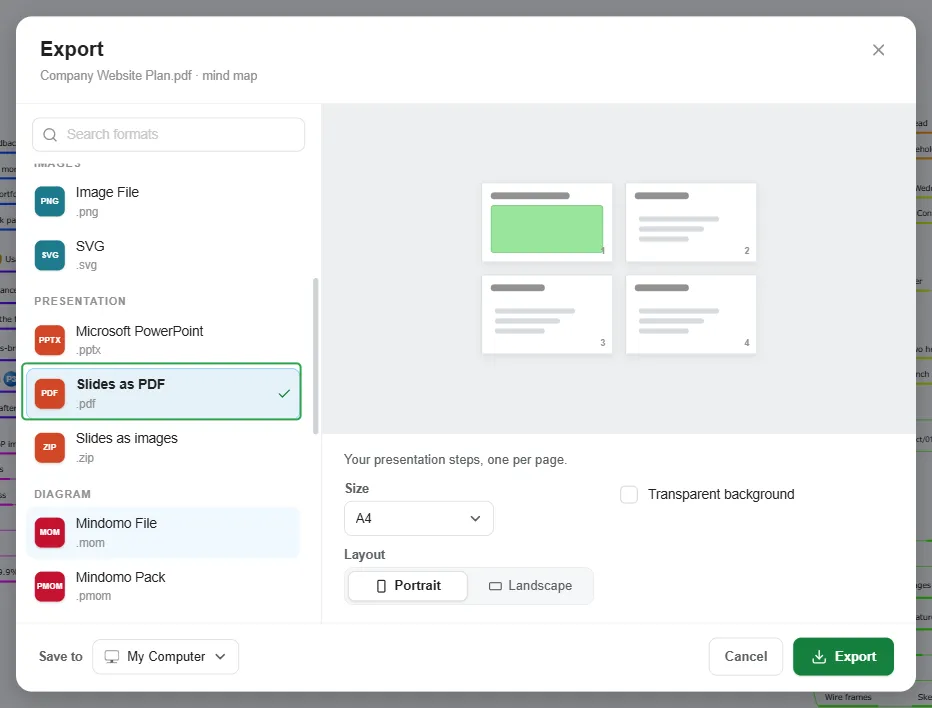
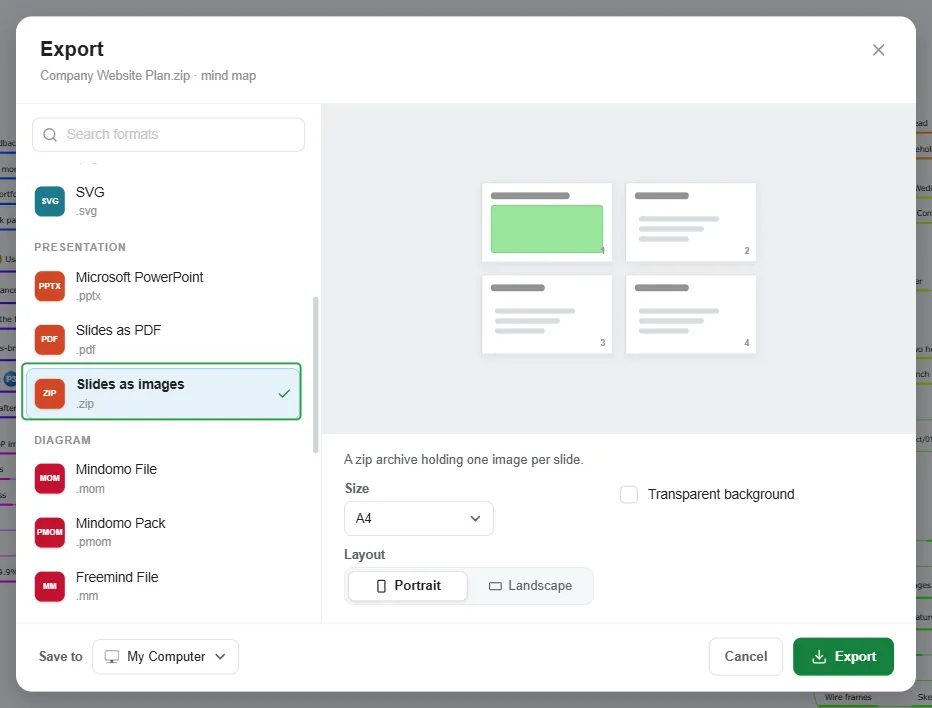
Section titled “Slides (.pdf, .zip)”Two formats export your presentation steps without PowerPoint: Slides as PDF puts them in one document; Slides as images gives you a separate picture for each. Both have the same options: Size (A4 by default), Layout (Portrait or Landscape), and Transparent background.
Slides as PDF (.pdf)
Section titled “Slides as PDF (.pdf)”Your presentation steps, one per page, in the order of the presentation. Use it to print the presentation, hand it out after a meeting, or show it on a device without Mindomo or PowerPoint.
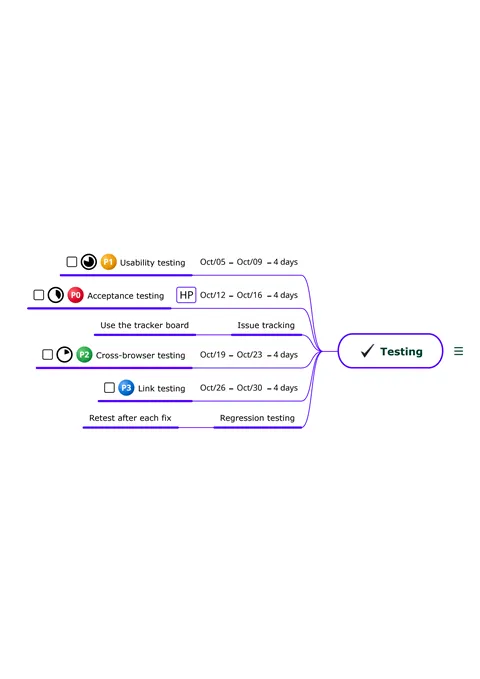
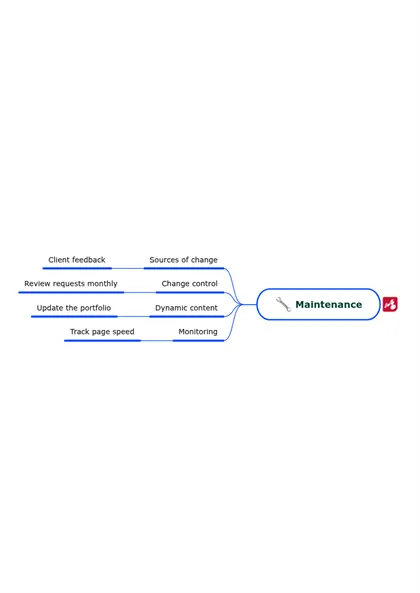
The export produces a PDF file with each step centered on its own page.
Slides as images (.zip)
Section titled “Slides as images (.zip)”A zip archive holding one image per slide. Use it when you need the slides as separate pictures, for example to place them in a document, on a website, or in another presentation app.
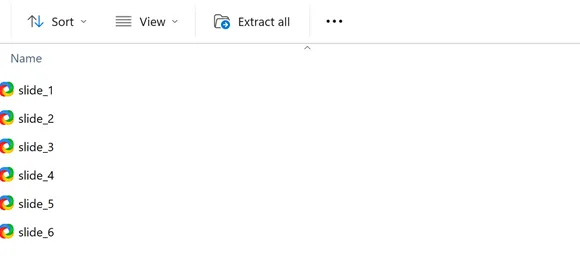
The zip file is named after your diagram, for example Company Website Plan.zip. Inside it, the slides are PNG files named slide_1.png, slide_2.png, and so on.
Each image is a full page with the step in the middle, like a page of Slides as PDF.
Diagrams
Section titled “Diagrams”Use these formats to keep working on your diagram later: import the file back into Mindomo, or open it in another mind mapping app.
Mindomo (.mom, .pmom)
Section titled “Mindomo (.mom, .pmom)”Mindomo File (.mom)
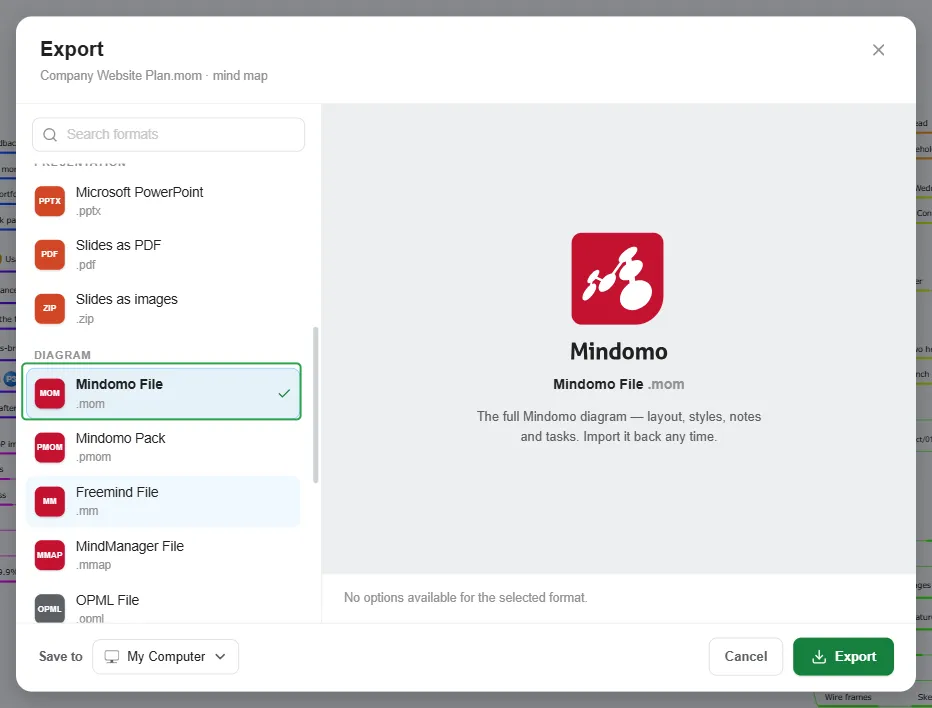
Section titled “Mindomo File (.mom)”Keeps the diagram itself: the topics and their layout, the theme and styles, notes, comments, tasks, hyperlinks, images, and the presentation steps. Import it back any time and the diagram is exactly as you left it. Use it for backups, or to move a diagram to another account.
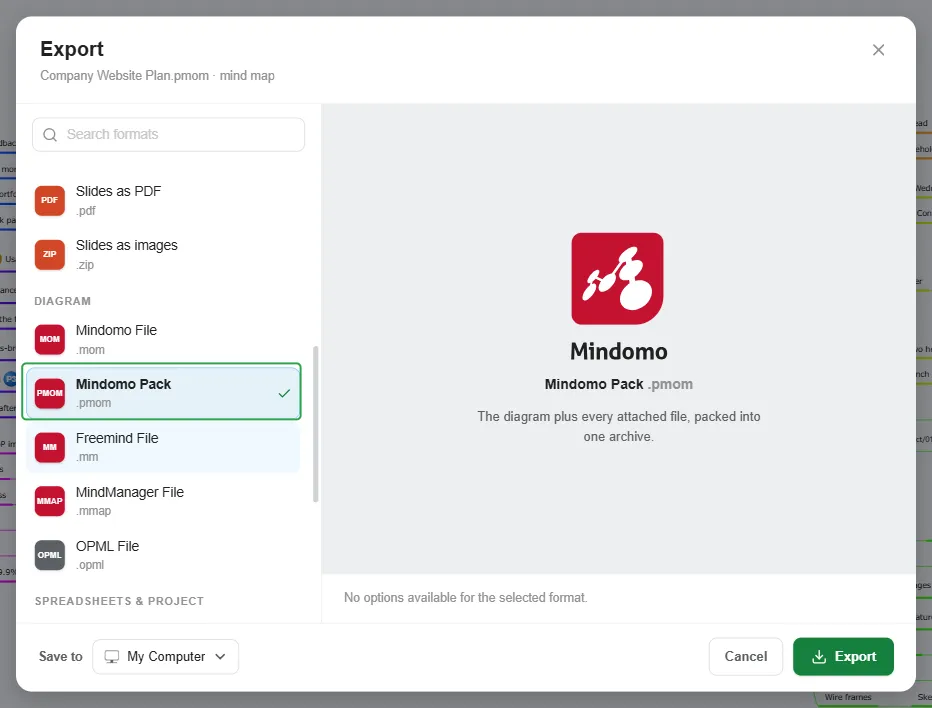
Mindomo Pack (.pmom)
Section titled “Mindomo Pack (.pmom)”Everything a Mindomo File (.mom) holds, plus the files attached to its topics, such as a PDF, packed into one archive. Because the attachments travel with the diagram, the file is larger than a .mom. Use it to keep a complete copy of a diagram that has attachments, or to share it with someone who uses Mindomo Desktop: they can open the diagram and its attachments on their own computer. To bring it back into Mindomo, see Importing Mind Maps.
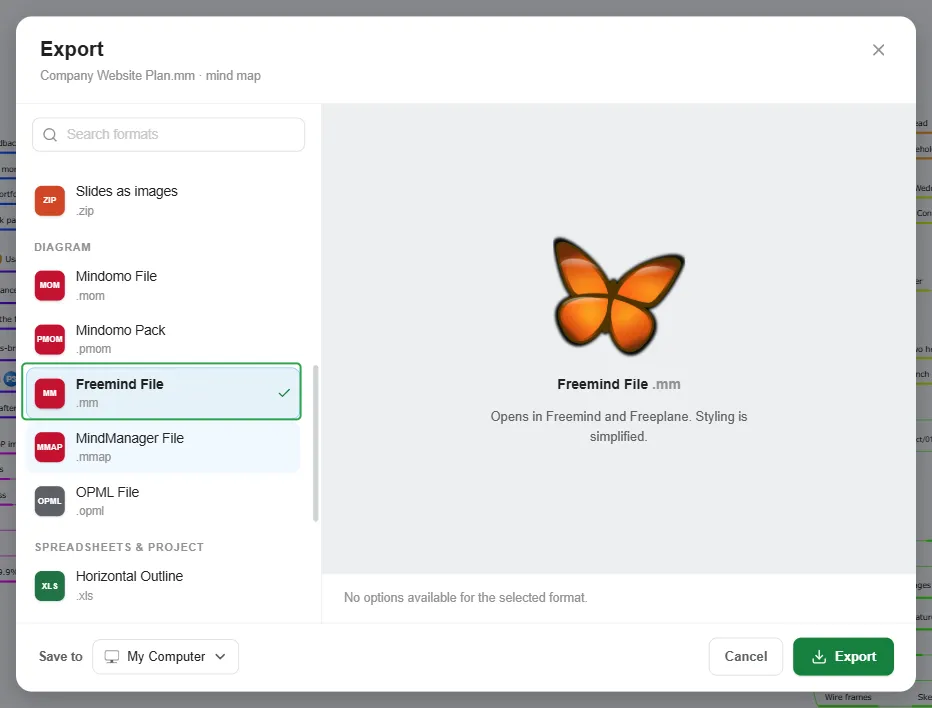
Freemind File (.mm)
Section titled “Freemind File (.mm)”For Freemind and Freeplane. Use it to continue working on the diagram in one of them, or to share it with someone who uses them.
- Kept: the topic tree, the topic text, and notes. A task’s priority becomes a numbered priority icon, and a topic with an attached file gets a paper clip icon.
- Simplified: colors, shapes, and layout follow Freemind’s own style.
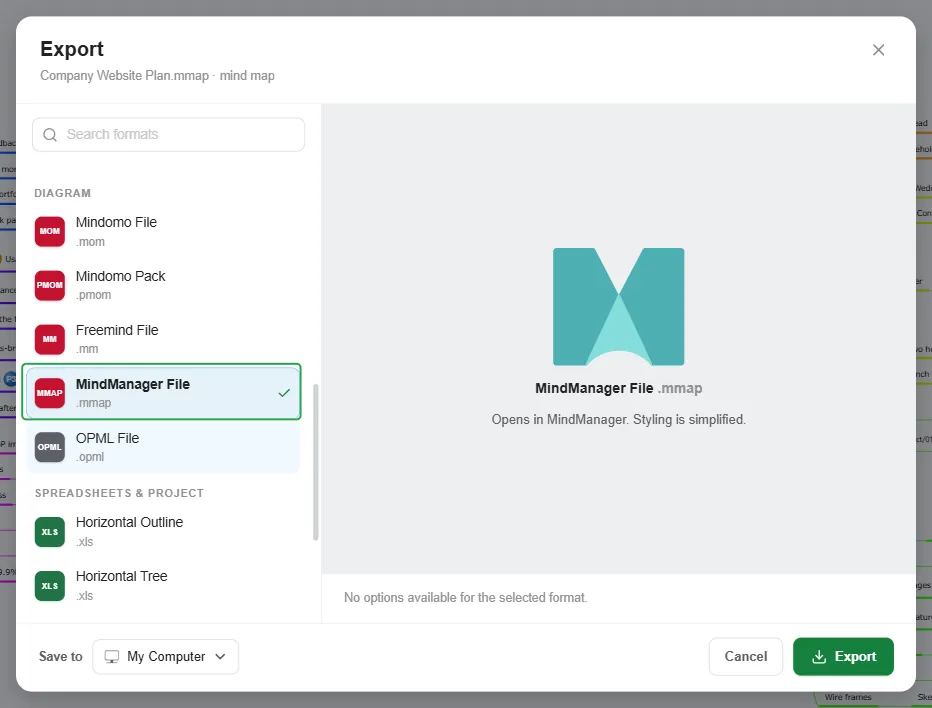
MindManager File (.mmap)
Section titled “MindManager File (.mmap)”For MindManager, a mind mapping and project planning app.
- Kept: the topic tree, floating topics, notes, hyperlinks, icons, topic images, and task information (start date, due date, duration, progress, and priority).
- Simplified: colors, shapes, and layout follow MindManager’s own style.
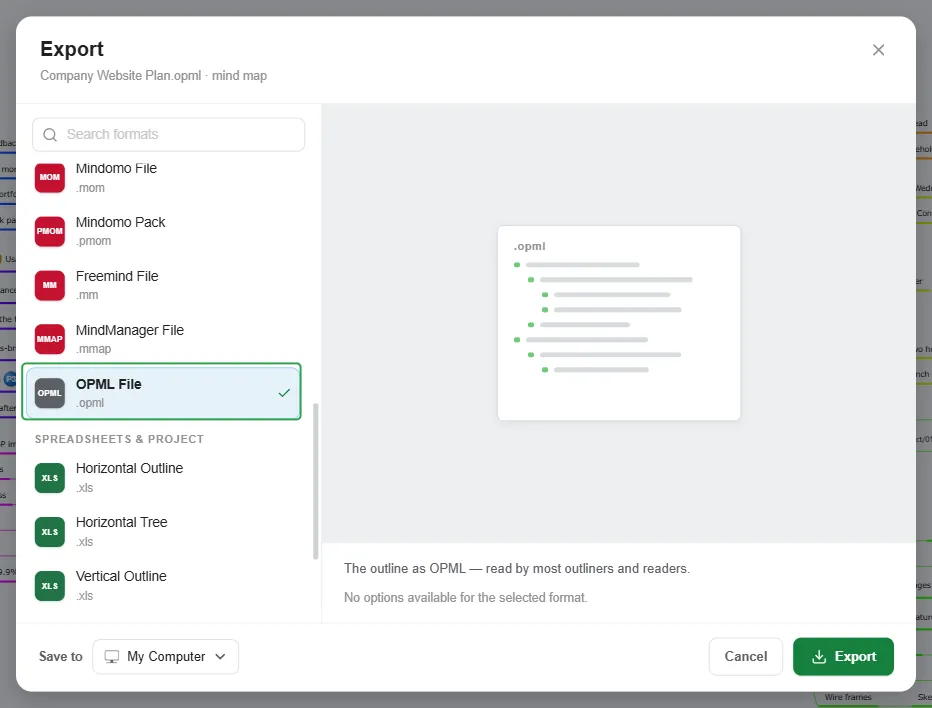
OPML File (.opml)
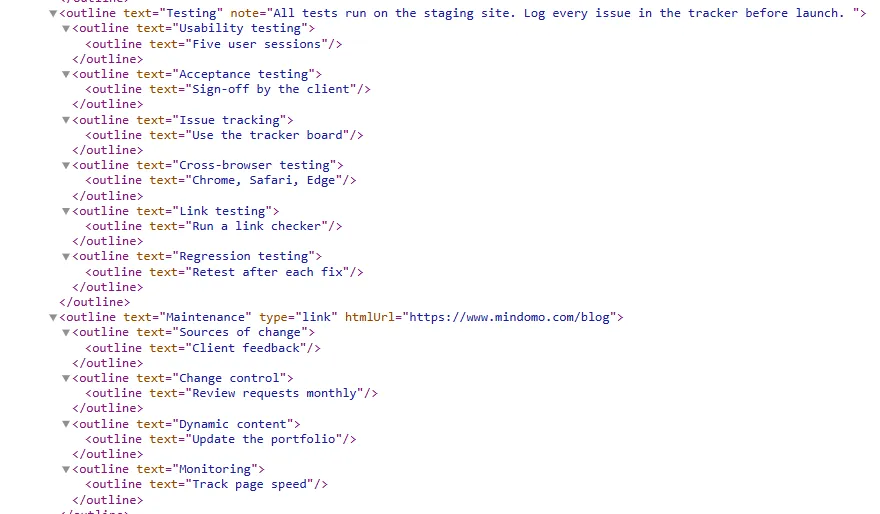
Section titled “OPML File (.opml)”Your diagram as an outline in OPML (Outline Processor Markup Language), a standard format that many outliner and note-taking apps can import. Each topic becomes an outline entry, a note becomes the entry’s note, and a hyperlink turns the entry into a link.
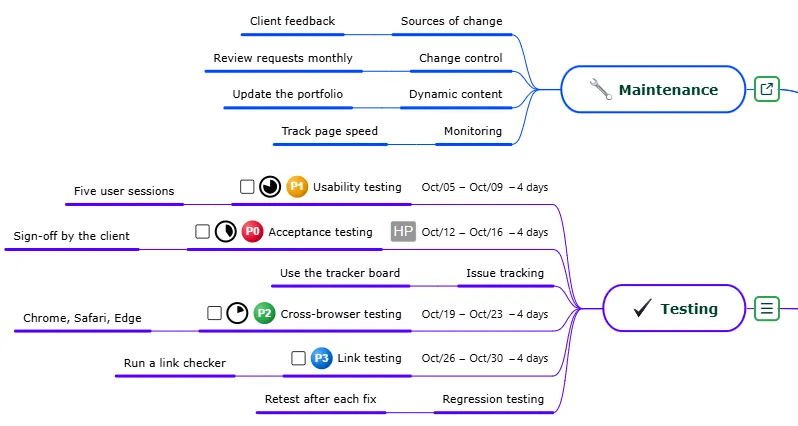
In this mind map, Testing has a note and Maintenance a hyperlink:
In the OPML file, the note becomes the note of the Testing entry, and the hyperlink becomes the htmlUrl of the Maintenance entry:
Spreadsheets & project files
Section titled “Spreadsheets & project files”Excel (.xls)
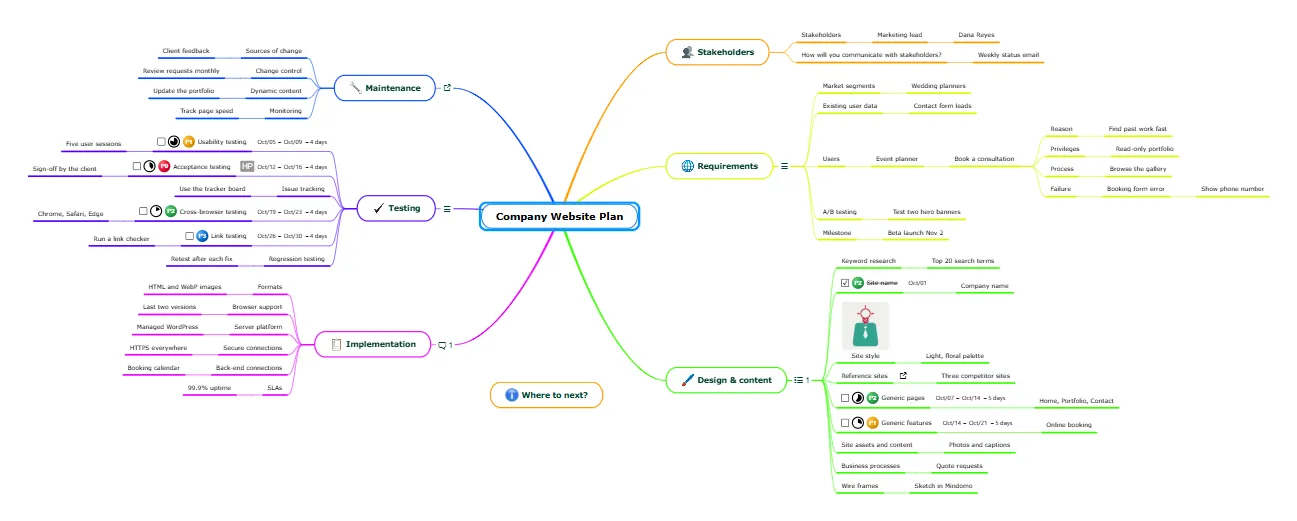
Section titled “Excel (.xls)”The four Excel formats create an .xls file with one sheet, one topic per cell. The examples below are all exported from this mind map:
Horizontal Outline (.xls)
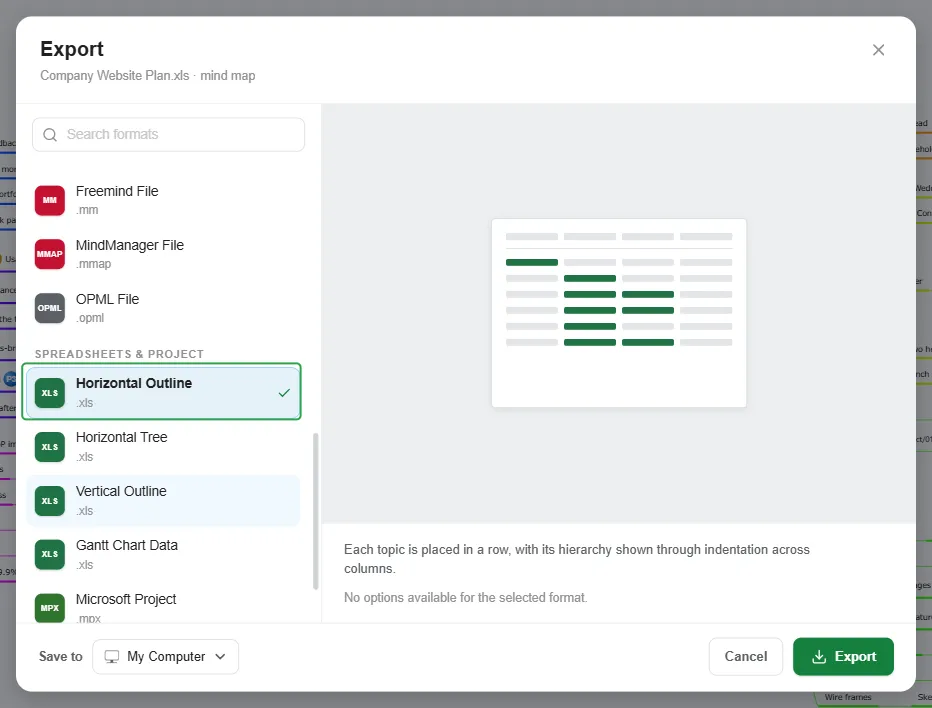
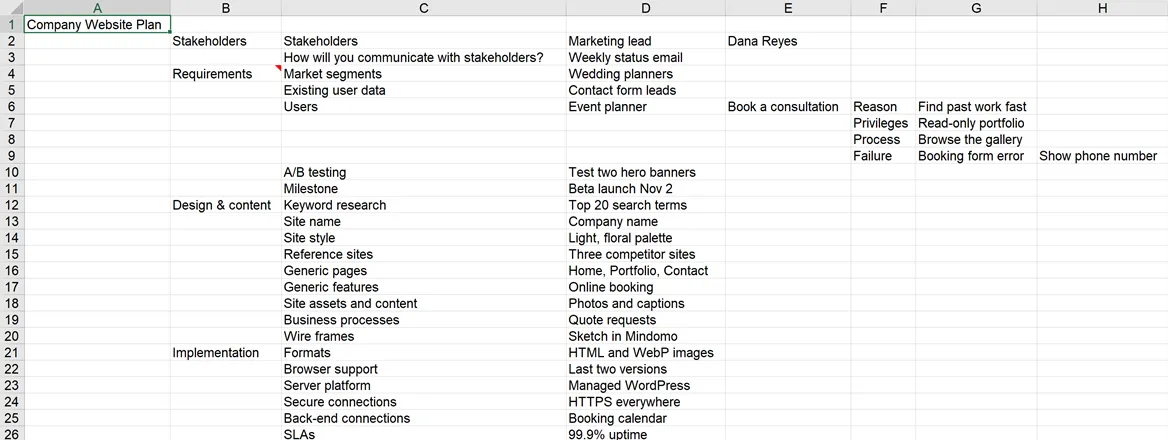
Section titled “Horizontal Outline (.xls)”The central topic is placed in the first cell and main topics in column B. Each subtopic starts on the same row as its parent, one column to the right, and its siblings follow on the rows below, so the sheet stays compact. Topic notes become cell comments, marked by a red triangle in the corner of the cell.
The exported sheet:
Horizontal Tree (.xls)
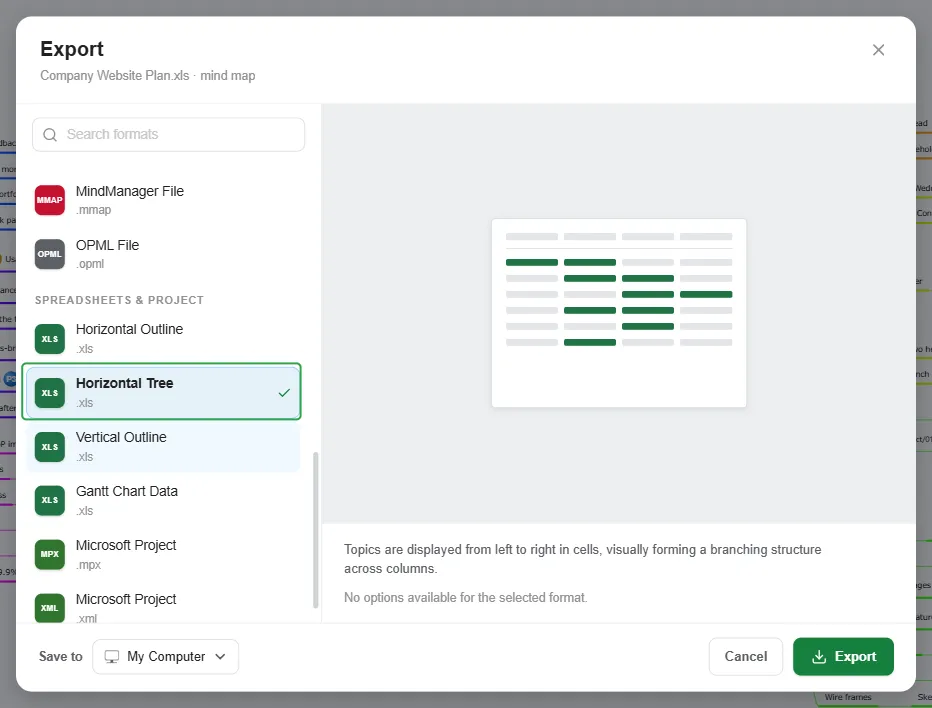
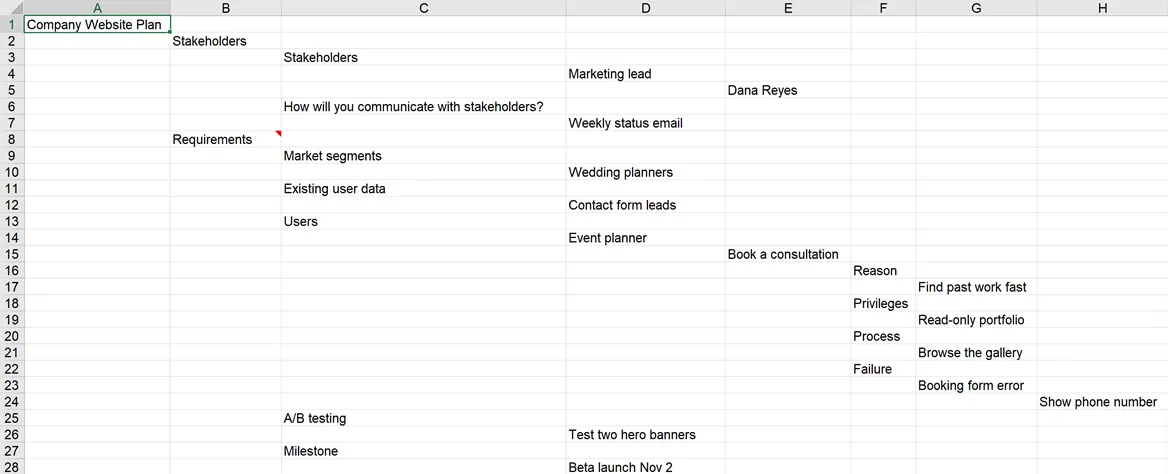
Section titled “Horizontal Tree (.xls)”Each topic gets a row of its own, one column further to the right for each level, so the sheet reads like the outline of the diagram. Because no two topics share a row, this layout is the easiest to sort, filter, or turn into a checklist.
The exported sheet:
Vertical Outline (.xls)
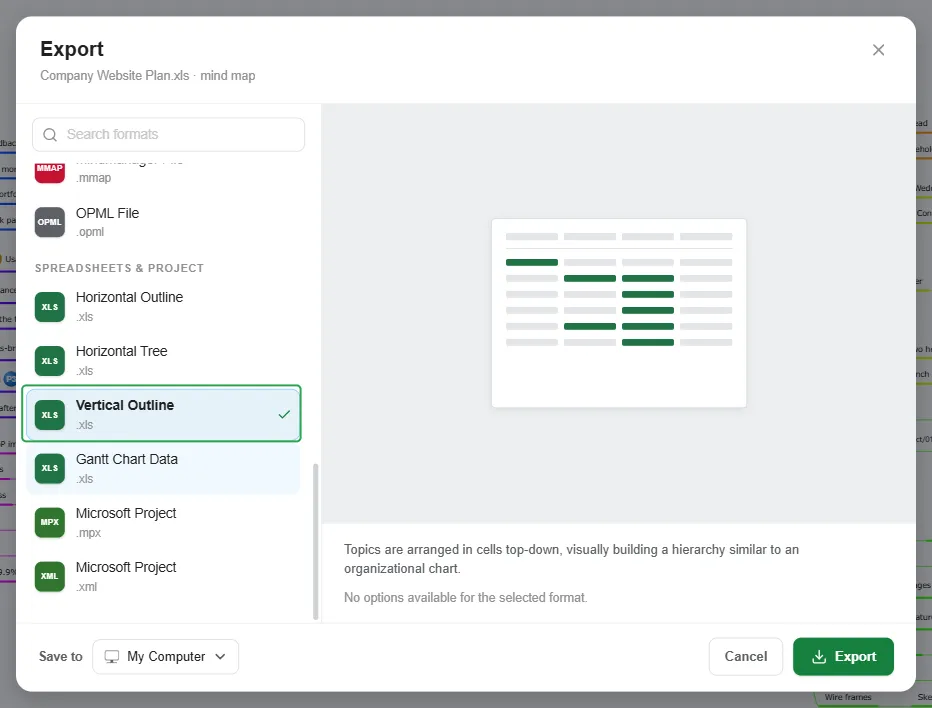
Section titled “Vertical Outline (.xls)”Topics are arranged in cells top-down: the central topic in the first row, main topics in the second, and each level of subtopics in the row below its parent, like an organizational chart. Each level adds a row and the topics spread across the columns, so this layout suits diagrams with few levels, such as a team structure.
The exported sheet:

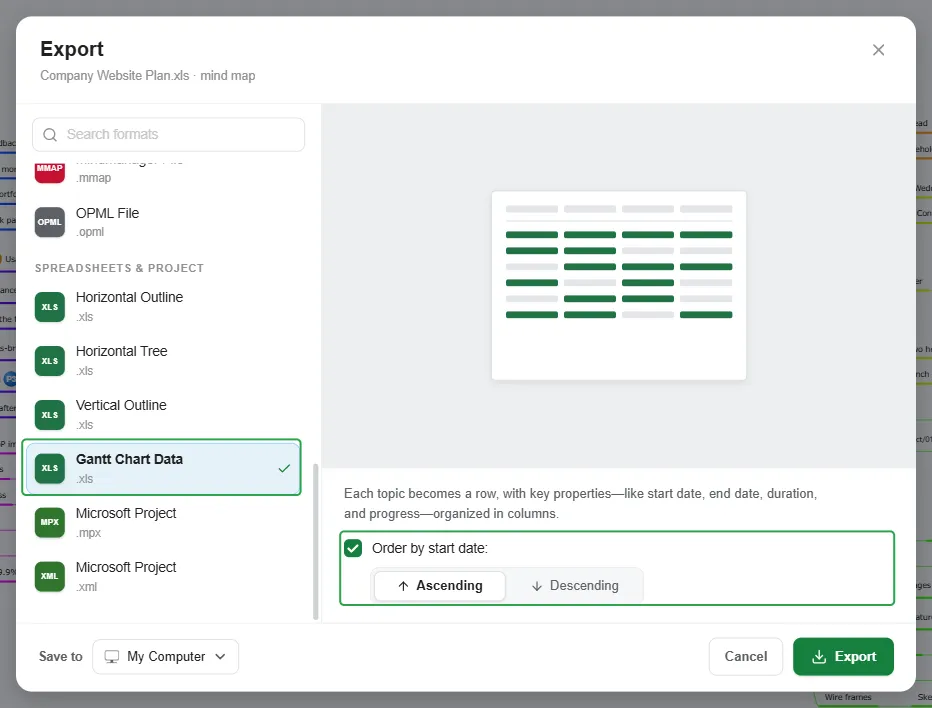
Gantt Chart Data (.xls)
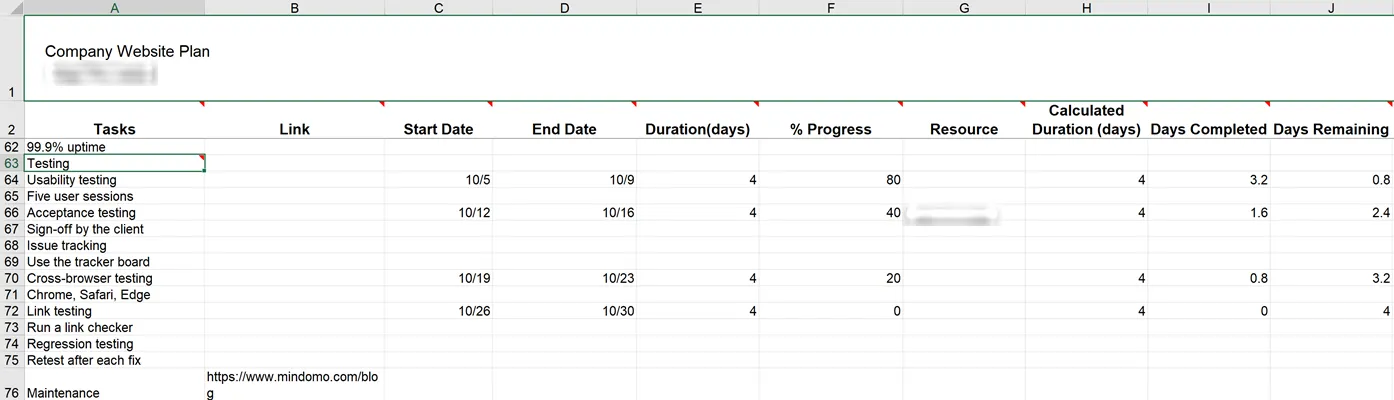
Section titled “Gantt Chart Data (.xls)”Each topic becomes a row, with key properties like start date, end date, duration, and progress organized in columns. Turn on Order by start date to sort the rows Ascending or Descending. Leave it off to keep the order of the diagram.
The sheet starts with the diagram name and its owner, followed by the columns Tasks, Link, Start Date, End Date, Duration(days), % Progress, Resource, Calculated Duration (days), Days Completed, Days Remaining, Working Days, and Markers. Topics without task information are listed with empty date columns.
Microsoft Project (.mpx, .xml)
Section titled “Microsoft Project (.mpx, .xml)”Two formats carry your tasks to Microsoft Project: .mpx, a plain-text file, and .xml, Microsoft Project’s XML interchange format. Neither has options.
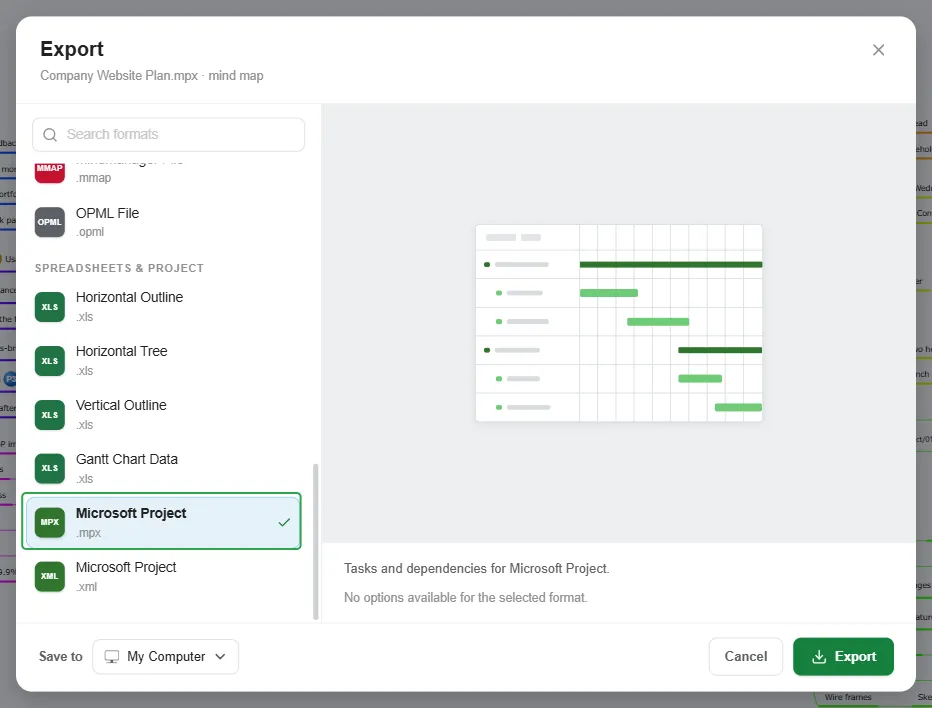
Microsoft Project (.mpx)
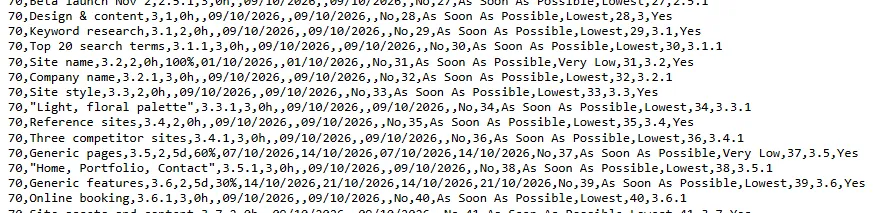
Section titled “Microsoft Project (.mpx)”Tasks and dependencies for Microsoft Project. Every topic below the central topic becomes a task: main topics are summary tasks, and the outline numbers follow the diagram (1, 1.1, 1.2…). Durations, progress, and start and finish dates come from the task information, and notes become task notes. A topic without dates gets the day of the export as its start date.
The file is plain text, one task per line:
Microsoft Project (.xml)
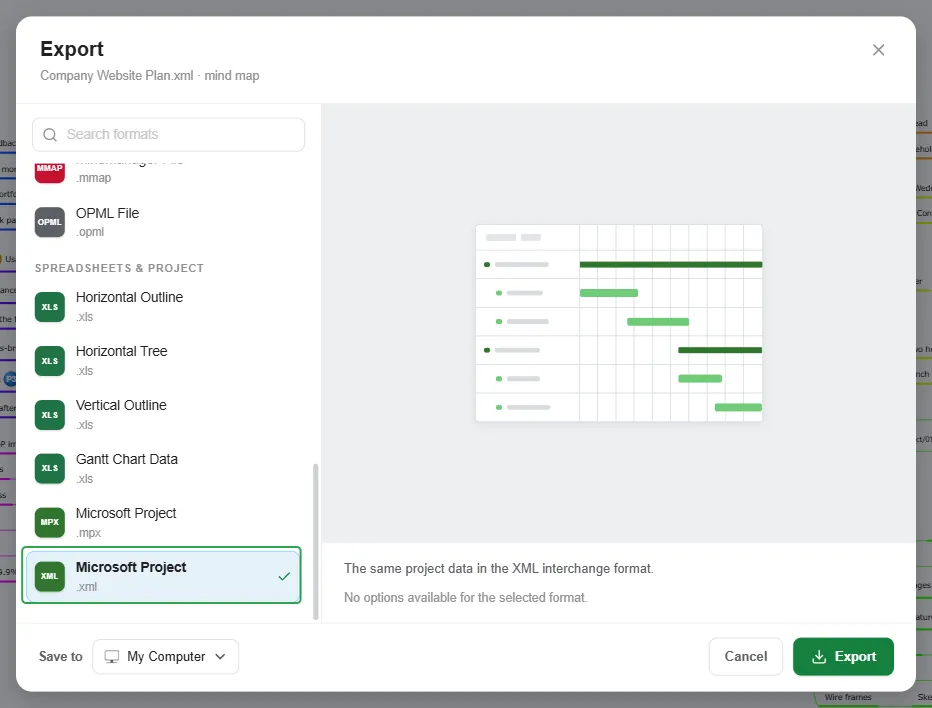
Section titled “Microsoft Project (.xml)”The same project data in the XML interchange format, with the central topic included as the top-level task and a standard working calendar (Monday to Friday, 08:00 to 17:00).
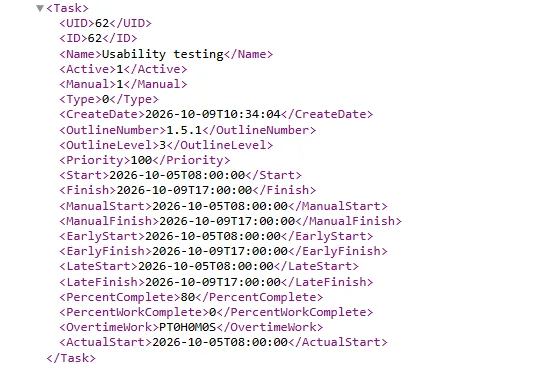
In the file, each topic is a Task element with its name, outline number, dates, and progress:
Export as a Gantt chart
Section titled “Export as a Gantt chart”To export a mind map as a Gantt chart, switch to the Gantt view first: click the menu button next to the diagram title and select View as Gantt. Then open the same menu again and select Export. If you open a Gantt chart directly, it is already in this view.
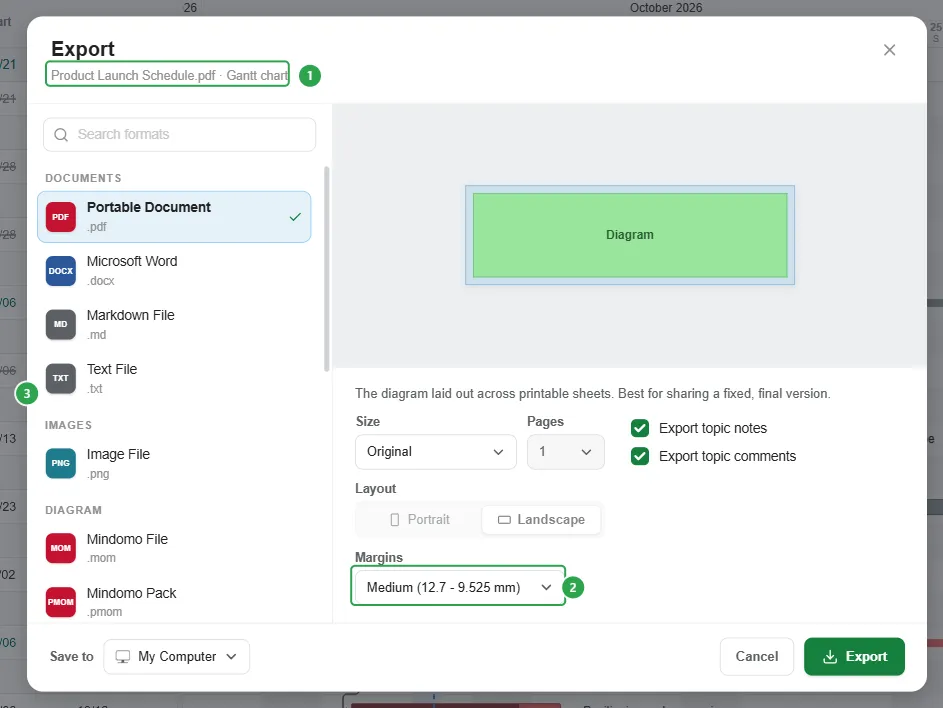
The dialog works as it does for a mind map, with a few differences:
- The file name is followed by Gantt chart (1).
- The list has 16 formats instead of 21 (3). HTML, SVG, and the Presentation formats are not available for Gantt charts.
- The PDF and the PNG show the chart with its timeline. The PDF has Size and Margins options (2).
To learn more about Gantt charts, see Gantt Charts.
Export as an outline
Section titled “Export as an outline”To export a mind map as an outline, switch to the Outline view first: click the menu button next to the diagram title and select View as Outline. Then open the same menu again and select Export. If you open an outline directly, it is already in this view.
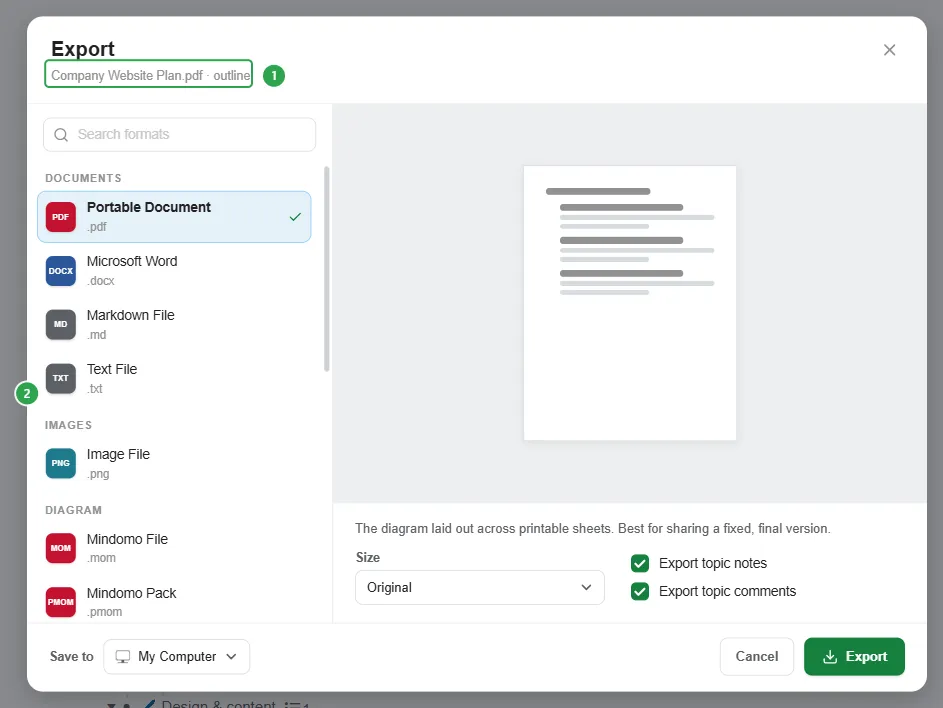
The dialog works as it does for a mind map, with a few differences:
- The file name is followed by outline (1).
- The list has 16 formats instead of 21 (2). HTML, SVG, and the Presentation formats are not available for outlines.
- The PDF is laid out as a bulleted list, and the PNG as one tall image.
For more on exporting outlines, see Exporting an outline.